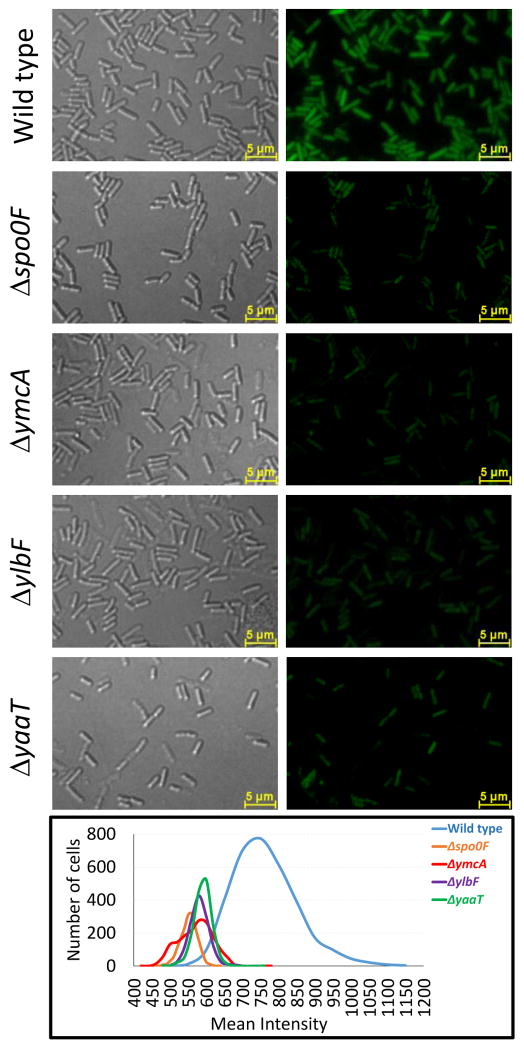
Fig. 5.
The distribution of fluorescence in cells expressing P2sinI-gfp is shifted to lower values in ylbF, ymcA, yaaT and spo0F strains. All of the representative images shown were obtained with identical microscope settings and were processed in the same way. Fluorescence intensity was measured for a population of cells and all the distributions were plotted together in the bottom panel for comparison. The strains used were wild-type P2sinI-gfp (BD7799), Δspo0F P2sinI-gfp (BD7800), ΔymcA P2sinI-gfp (BD7806), ΔylbF P2sinI-gfp (BD7807), ΔyaaT P2sinI-gfp (BD7805). Growth was in MSgg and all the strains were constructed in the 3610 background.

