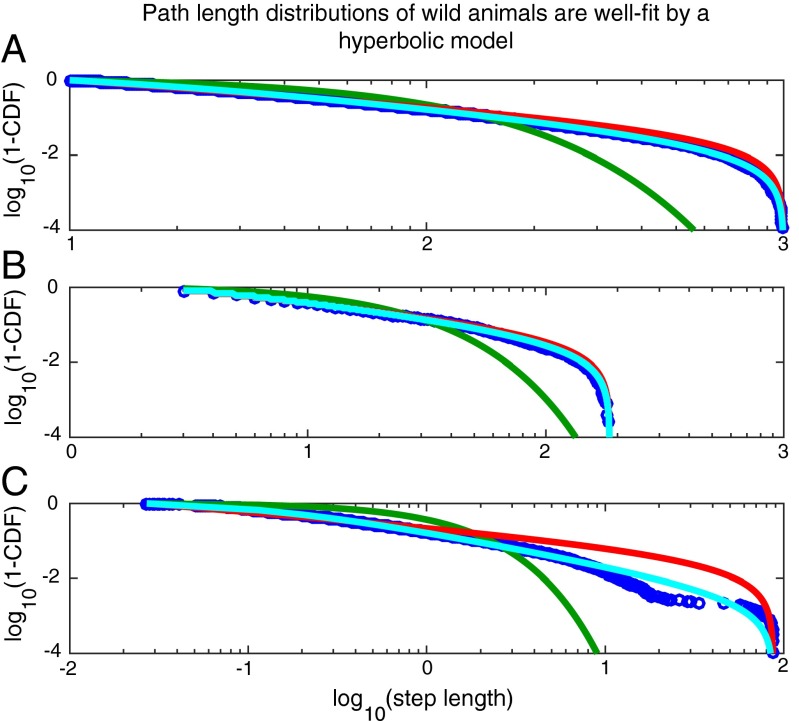
Fig. 3.
Previously collected data from wild animals are better fitted by a hyperbolic model than by a power law model. (A) Random data generated from a hyperbolic distribution (blue circles) can be well approximated by a power law distribution (red), but not by an exponential distribution (green): 25,000 random numbers were generated from a hyperbolic distribution (Eq. 2) (Methods) with truncation set to be between 10 and 1,000 (see Fig. S4 for more parameters). The best fit truncated power law describes the data significantly better than the best fit exponential (wAICtp = 1.000 and wAICexp = 0.000). (B) Previously collected data (blue circles) that are well fitted by a hyperbolic model (cyan) and a power law model (red), but not by an exponential model (green) (see Fig. S5 for fits across many subjects). (C) Data from a subject in which the hyperbolic model is considerably preferred to any alternative model.

