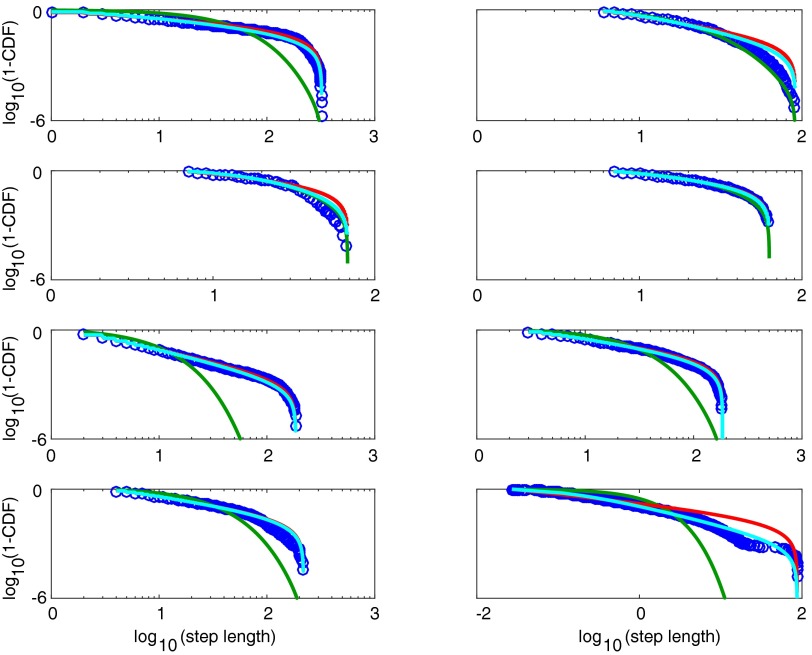
Fig. S5.
Hyperbolic, power law, and exponential fits to all eight individual subjects shown in Table 1. The first row shows individuals 1 and 2, the second row shows individuals 3 and 4, etc. Data are shown in blue. Exponential fits are shown in green, power law fits in red, and hyperbolic fits in cyan.

