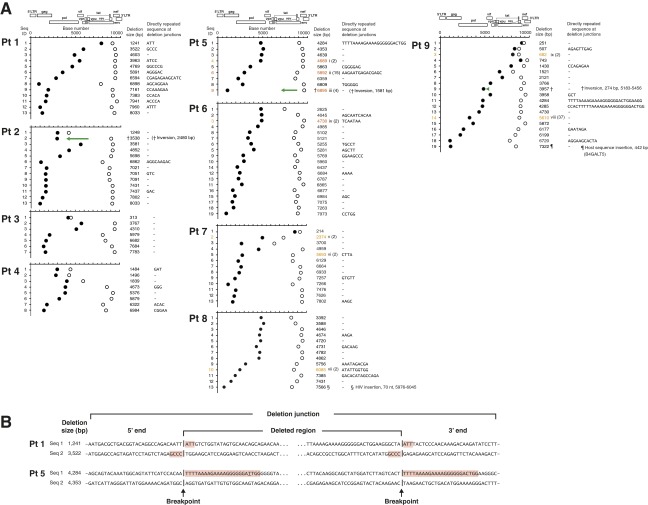
Fig. S3.
Deletion junction analysis of HIV-1 proviruses. (A) Deletion junctions are plotted for each proviral DNA sequence from four patients with pVL ≥ 40 copies per milliliter (Pts 1–4), four patients with pVL < 40 copies per milliliter (Pts 5–8), and one patient (Pt 9) before and after suppressive cART. The 5′-ends of the deletion junctions are depicted by closed circles; and the 3′-ends of the deletion junctions are depicted by open circles. The sizes and locations of deletions were determined by comparing the sequences of the proviral DNA with the full-length sequence of HIV-1 HXB2. Clonally expanded populations are identified by Roman numerals and are the same numbers used in Figs. 1 B and E. Numbers in parentheses indicate the number of identical provirus sequences found for each clone. Green arrows facing in opposite directions relative to the reference HXB2 genome sequence represent a gene segment corresponding to inversion in deletion. (B) DNA sequences of truncated provirus at the deletion junctions. Two sequences from Pt 1 (pVL = 225,658 copies per milliliter) and two sequences from Pt 5 (pVL < 40 copies per milliliter) are shown. Directly repeated sequences are highlighted in red. A single nucleotide mismatch within a directly repeated sequence in patient 5 is underlined.

