Fig. 3.
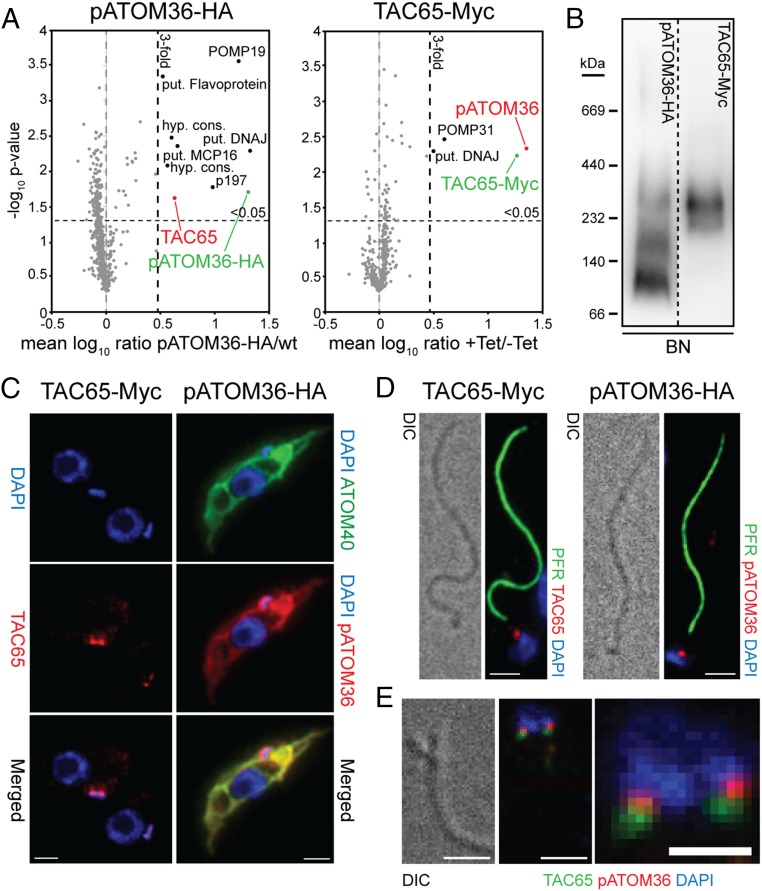
pATOM36 interacts with a previously uncharacterized TAC component. (A) Reciprocal SILAC-IPs of C-terminally HA-tagged pATOM36 and C-terminally Myc-tagged TAC65 from digitonin-solubilized mitochondrial extracts. Mean log10 ratios (induced/uninduced) of proteins detected by quantitative MS in three independent experiments are plotted against the corresponding –log10 P values (one-sided t test). Horizontal dashed lines indicate a P value of 0.05, whereas the vertical black dashed lines mark a threefold-enrichment. The bait proteins are indicated in green. For a complete list of proteins, see Datasets S2 and S3. (B) BN-PAGE of mitochondria-enriched fractions of the procyclic cells expressing either pATOM36-HA or TAC65-Myc. Immunoblots were probed with anti-HA or anti-Myc antibodies, respectively. (C) IF analysis of procyclic T. brucei cells expressing either TAC65-Myc or pATOM36-HA, respectively. DNA is stained with DAPI (blue). ATOM40 serves as a mitochondrial marker (green). HA- or Myc-tagged proteins are shown in red. (Scale bar, 2 µm.) (D) Isolated flagella from procyclic cells expressing TAC65-Myc or pATOM36-HA, respectively. DNA is stained with DAPI (blue). The anti-PFR antiserum stains the paraflagellar rod (green). HA- and Myc-tagged proteins are shown in red. Differential interference contrast (DIC). (Scale bar, 2 µm.) (E) Costaining of TAC65-Myc and pATOM36-HA in isolated flagella. TAC65-Myc is shown in green, pATOM36-HA is shown in red, and the DNA is stained with DAPI (blue). [Scale bar, (Left) 2 µm and (Right) 1 µm.]

