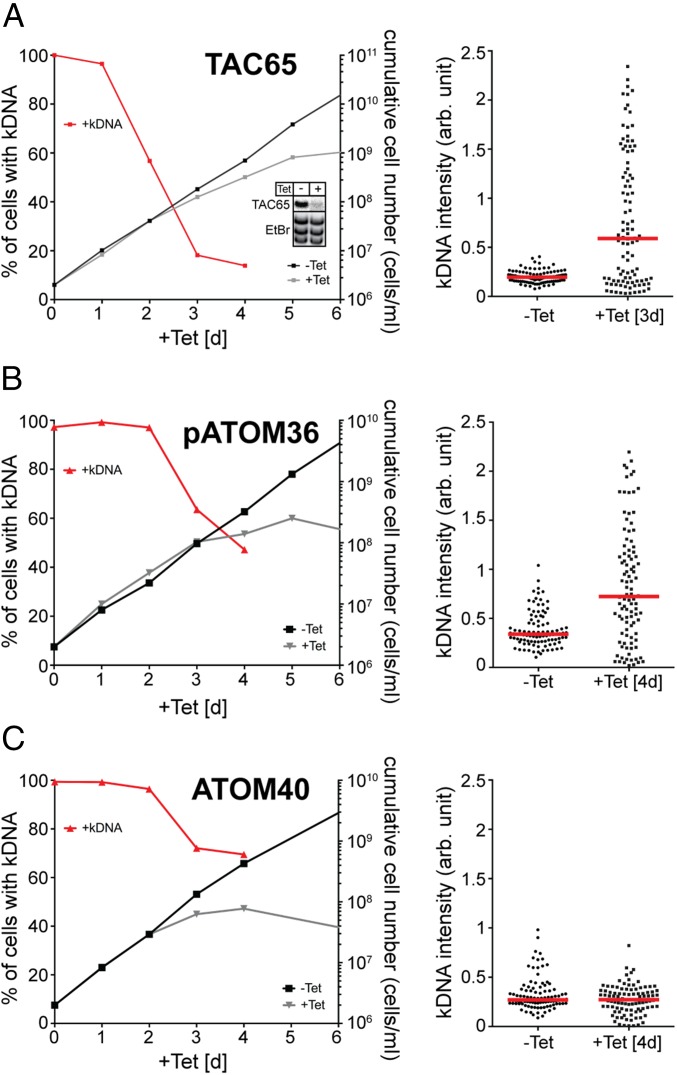
Fig. 4.
Ablation of TAC65 and pATOM36 causes missegregation of kDNA. (Left) Graphs showing growth curves and loss of kDNA of the indicated knockdown cell lines. Red lines depict percentage of cells still having the kDNA. (Right) Fluorescent intensities of kDNA networks were measured in the indicated knockdown cell lines. Red lines mark the median. Time of induction is indicated. (A) TAC65-RNAi cell line. (Inset) Northern blot showing ablation of TAC65 mRNA. EtBr-stained rRNAs serve as a loading control. (B) pATOM36-RNAi cell line targeting the ORF. (C) ATOM40-RNAi cell line. Northern blots confirming the ablation of ATOM40 and pATOM36 in the corresponding RNAi cell lines have been published previously (13, 14).

