Fig. 6.
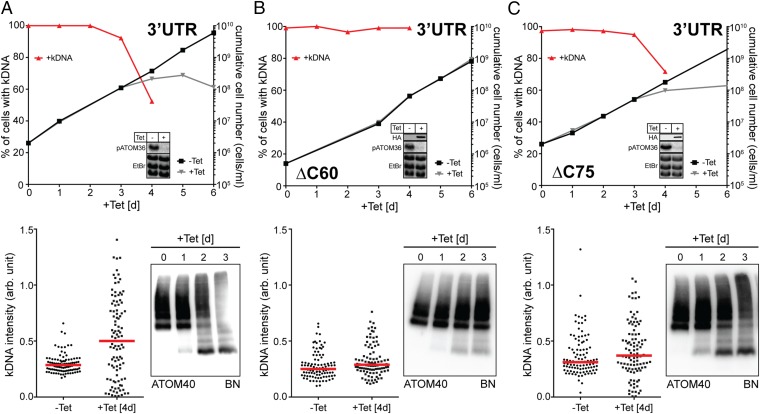
pATOM36 has distinct functions in the OM and the TAC. (A) pATOM36-3′UTR-RNAi cell line. (B) pATOM36-3′UTR-RNAi cell line complemented with an ectopically HA-tagged version of pATOM36 lacking the C-terminal 60 amino acids (ΔC60). (C) Same as in B, but complementation was done with a pATOM36 version lacking the last 75 amino acids (ΔC75). (Upper) Graphs showing growth curves and loss of kDNA of the indicated knockdown and complemented 3′UTR-RNAi cell lines. Red lines depict percentage of cells still having the kDNA. (Insets) Northern blots demonstrating ablation of endogenous pATOM36 mRNA. The corresponding EtBr-stained rRNAs serve as loading controls. For the complemented cell lines, immunoblots showing the expression of the inducible HA-tagged versions of pATOM36 are also shown. (Bottom Left) Graph of the fluorescent intensities of kDNA networks in the indicated knockdown cell lines. Time of induction is indicated. Red lines mark the median. (Bottom Right) BN-PAGE (BN) immunoblots of mitochondrial-enriched fractions at the indicated time points after induction of pATOM36-RNAi stained with the anti-ATOM40 antiserum.

