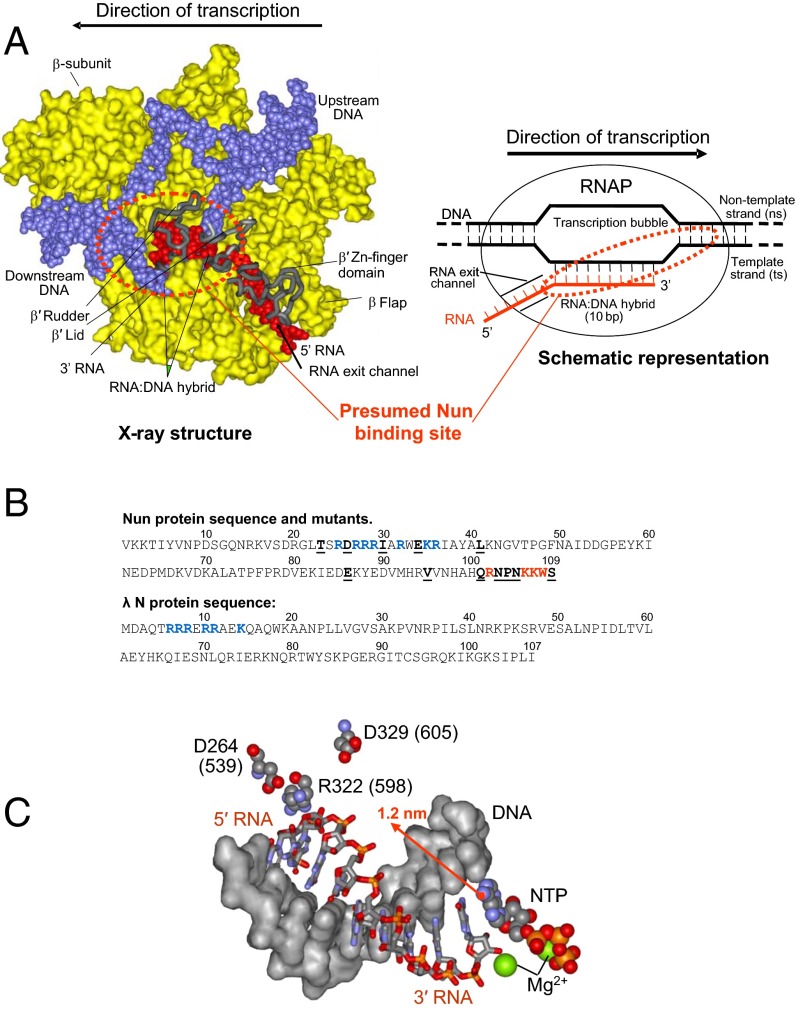
Fig. 1.
Nun interactions in transcription elongation complex. (A, Left) X-ray model of TEC. DNA is shown in blue, RNA in red, RNAP proteins in yellow (surface representation). Most of the β′ subunit is omitted for clarity. Main features of TEC are marked. The dotted circle shows the Nun binding sites inferred from our cross-linking data. A schematic representation of TEC featuring its nucleic acid scaffold is shown on the right. (B) Sequence of Nun and λ N proteins. The residues constituting the ARM motif are rendered in blue. Residues that when mutated display strong phenotypes are highlighted in red. Other mapped positions of Nun mutations are underlined. (C) Spatial arrangement of RNA:DNA hybrid of TEC and mutations in β′ subunit affecting Nun function. Residue numbering is as in Tth RNAP and in E. coli (in parentheses). The arrow indicates a possible position of the 3′ RNA-attached cross-linking group extruding into RNAP main channel.

