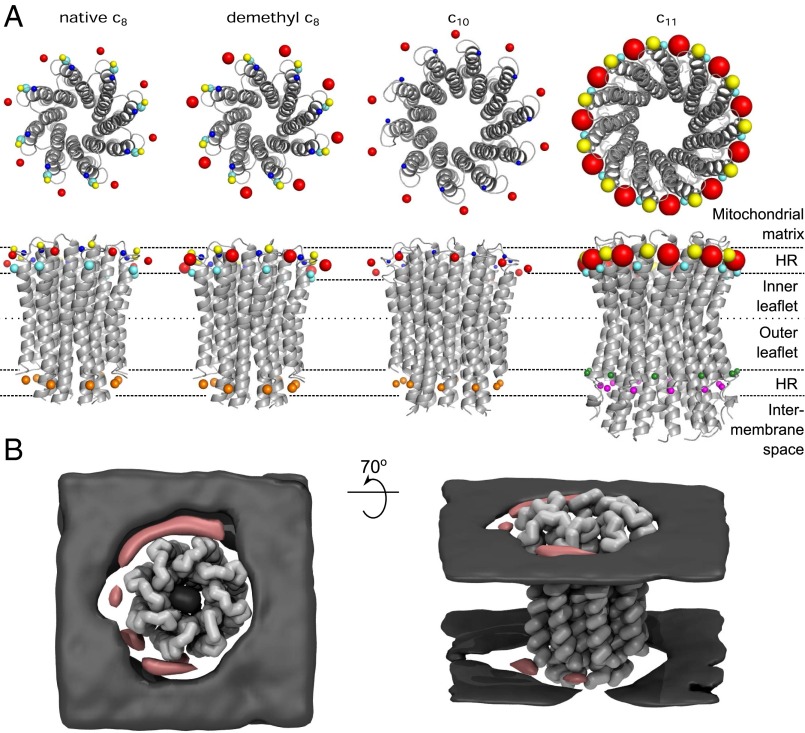
Fig. 2.
Locations of lipid head-groups around c-rings shown both from protein-centric (A) and lipid-centric (B) viewpoints. In the upper and lower lines of A, views of c-rings from, respectively, the mitochondrial matrix side of the membrane and in the plane of the bilayer (HR, head-group region). The comparative densities of the head-groups of cardiolipin around side chain beads of selected residues are shown by the relative sizes of the spheres. For each residue, the density is the maximum point on their radial distribution function. The colors of beads and amino acid residues in Fig. 1 correspond. For aligned sequences of c-subunits, see Fig. 1C. (B) Equivalent time-averaged densities of cardiolipin phosphate groups (pink) and POPC and POPE phosphate groups (gray) for the first repeat simulation of the native c8 ring. Densities for other simulations are shown in Fig. S11. The view is from the mitochondrial matrix side (Left) and with this view rotated behind the plane of the page by 70° (Right). The densities demonstrate the preferred position of cardiolipin proximal to the c-ring and the diffuse density of POPC and POPE.

