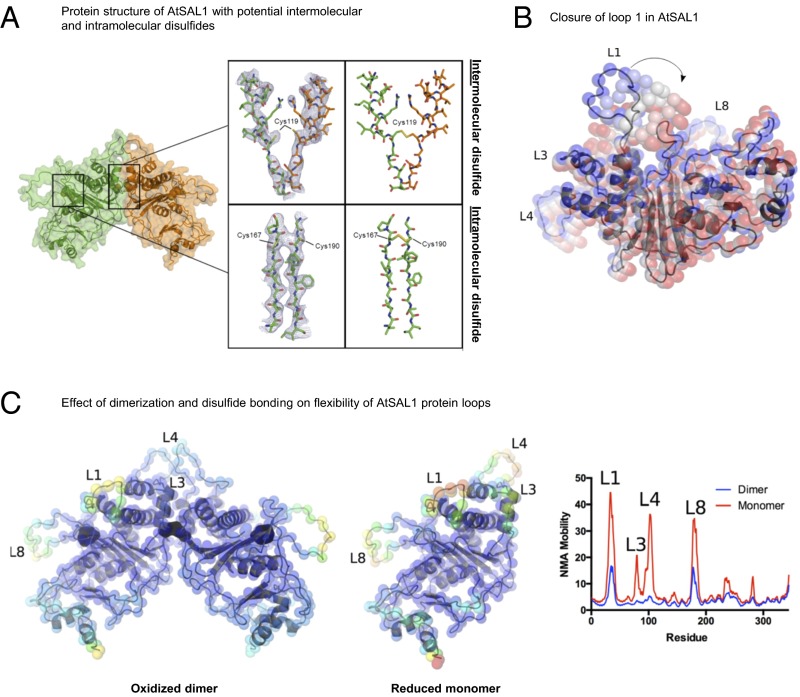
Fig. 3.
Structural basis for redox regulation of AtSAL1 activity. (A) (Left) Structural elucidation of AtSAL1 reveals a dimerization interface and three potentially redox-sensitive cysteine residues. (Middle) A view of the 2mFo-dFc map (blue lines, contoured at 1.0 σ) centered on Cys119 which is located at the interface between chain A (orange sticks) and chain B (green sticks) or a view of the 2mFo-dFc map centered on Cys167 and Cys190. (Right) The disulfide bonds present in an energy minimized model of the oxidized AtSAL1 dimer. (B) Closure of loop 1 of AtSAL1, as predicted by normal mode analysis (NMA) (31). The lowest-frequency normal mode is shown. Positions of Cα atoms are shown as colored spheres, from the crystal structure (blue) to the most closed conformation (red). (C) Dimerization and disulfide formation reduces the mobility of key loops (loops 1, 3, 4, and 8) in AtSAL1. Energy minimized models of the oxidized AtSAL1 dimer (Left) or the reduced AtSAL1 monomer (Middle) are colored according to mobility (blue indicating least mobile and red indicating most mobile); for details of energy minimization and normal mode analysis, see Materials and Methods. (Right) Plot of NMA mobility by residue for the oxidized dimer and reduced monomer.

