Fig. 1.
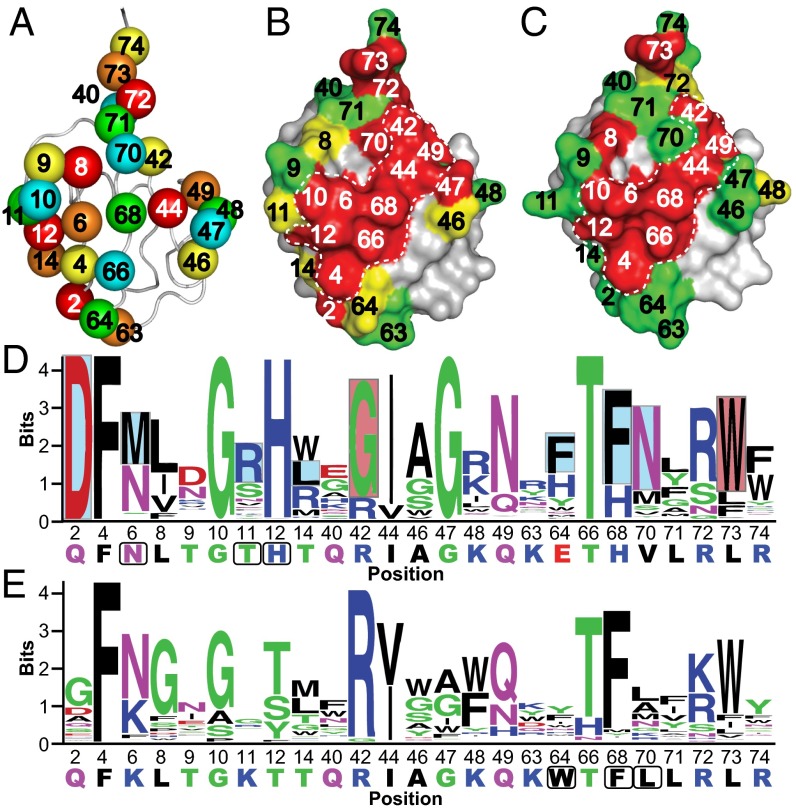
Saturation scans of Ubvs. (A) Library design. The USP binding site contains 25 residues distributed across three regions: region 1 (residues 2–14), region 2 (residues 40–49), and region 3 (residues 63–74). Five libraries were designed to scan five residues each, in a manner that maximized the distances between residues in any one library. Scanned residues are shown as spheres and are color-coded according to the library that they share. The structure was derived from the coordinates of WT Ub (PDB ID code 1UBQ). (B and C) The results of saturation scanning mapped on the structure of Ubv.2.1 (PDB ID code 3V6C) (B) or Ubv.21.4 (PDB ID code 3MTN) (C). The Ubv is shown as a surface colored according to bit values derived from amino acid frequencies (Fig. S2), as follows: green ≤ 2; 2 < yellow <2.7; red ≥ 2.7; gray, unscanned. The white dashed lines demarcate the core functional epitope. (D and E) The results of saturation scanning presented as sequence logos for Ubv.2.1 (D) or Ubv.21.4 (E). The sequence of each Ubv is shown at the bottom, and boxes demarcate sequences that differ from Ub.wt. Blue and red boxes indicate sequence changes in Ubv.2.1 predicted to enhance inhibition of USP2 for which enzyme inhibition assays did and did not validate predictions, respectively (Table 1).

