Fig. 3.
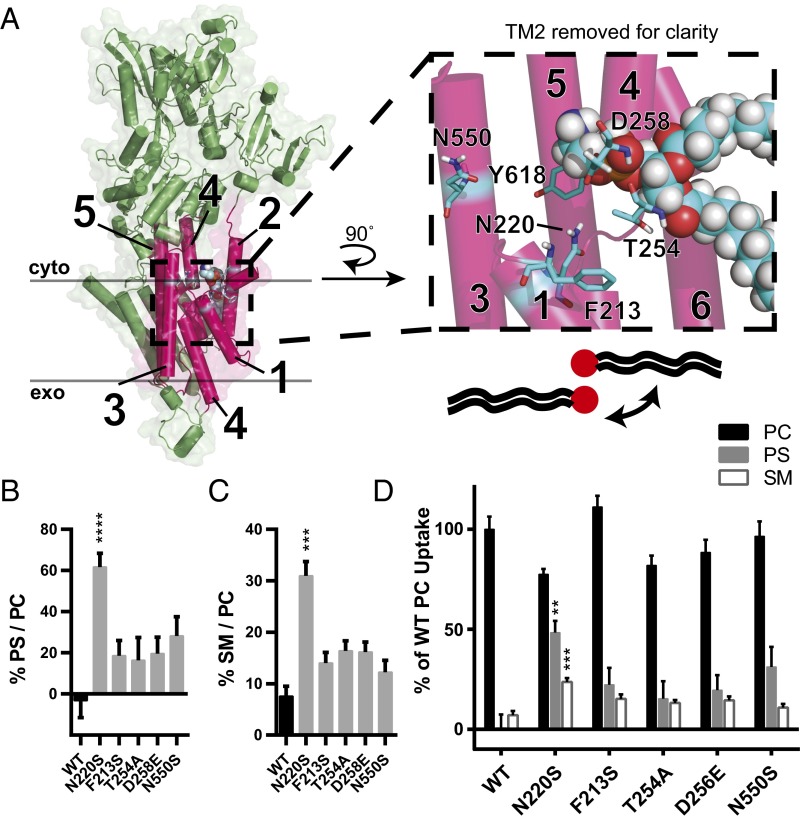
Predicted N220 positioning suggests that substrate backbone and acyl chains are coordinated by TM1 and TM3. (A) Homology model of Dnf1 (PDB ID code 3W5D) with TM 1–6 shown as pink cylinders, the rest of the protein colored green, surface shown, and key residues represented in stick form and colored by element. PE was modeled in the site as crystallized in 3W5D, shown in spheres and colored by element. PM boundaries are indicated. This orientation suggests that the PL headgroup is coordinated by TM2 and TM4, with the substrate backbone and acyl chains protruding between TM2, -4, and -6 (cartoon PL with red headgroup). (Inset) A 90° rotated and enlarged view of the PE site with TM2 removed for clarity. None of the TM2 or TM3 residues alter backbone preference, indicating that the substrate may be oriented in a 180° turn, with the headgroup still between TM2 and TM4 but with the backbone and acyl chains projecting past TM1 and TM3, respectively. (This proposal is illustrated by the cartoon PL and expanded upon with subsequent modeling in Fig. 4A.) (B) Exit gate substitutions F213S, T254A, D258E, and N550S increase PS preference over that of WT. (C) Exit gate substitutions F213S, T254A, D258E, and N550S do not recapitulate the SM preference of N220S. (D) PC, PS, and SM transport of exit gate mutants and N220S. n ≥ 9 ± SEM for all NBD transport data. Comparisons to WT ratio or substrate uptake were made with one-way ANOVA using Tukey’s post hoc analysis; **P < 0.01; ***P < 0.001; ****P < 0.0001.

