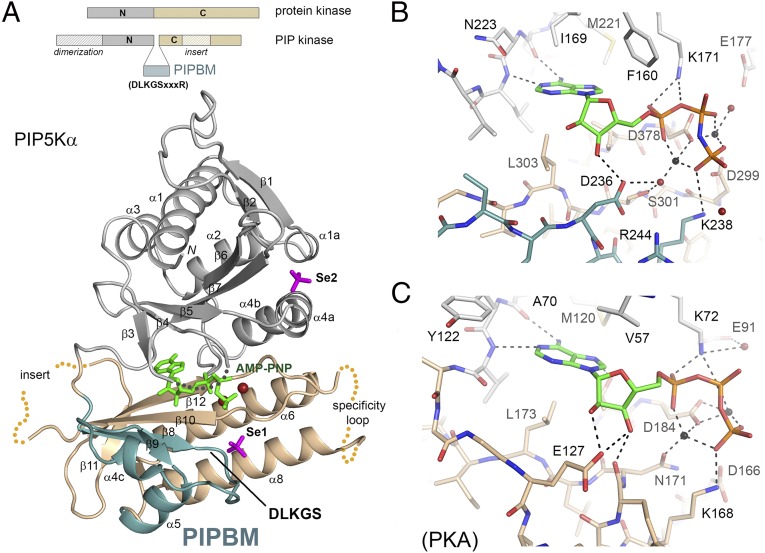
Fig. 1.
Overall structure and ATP binding site. (A) Domain organization. The schematic compares PIPKs with protein kinases. The overall structure of the zebrafish PIP5Kα in complex with AMP-PNP is shown below the schematic with the N-lobe (gray), the C-lobe (light tan), and the PIPB domain (blue). Disordered regions of the protein are indicated by dotted curves. Bound AMP-PNP and SeO42− are shown as stick models. (B) Structural details of the ATP-binding site of PIP5Kα. Hydrogen bonds are indicated by dotted lines. Red spheres represent water, and black spheres represent metal ions. (C) ATP-binding site of protein kinase A (PDB ID code 1ATP). Structural illustrations were all generated on PyMOL.

