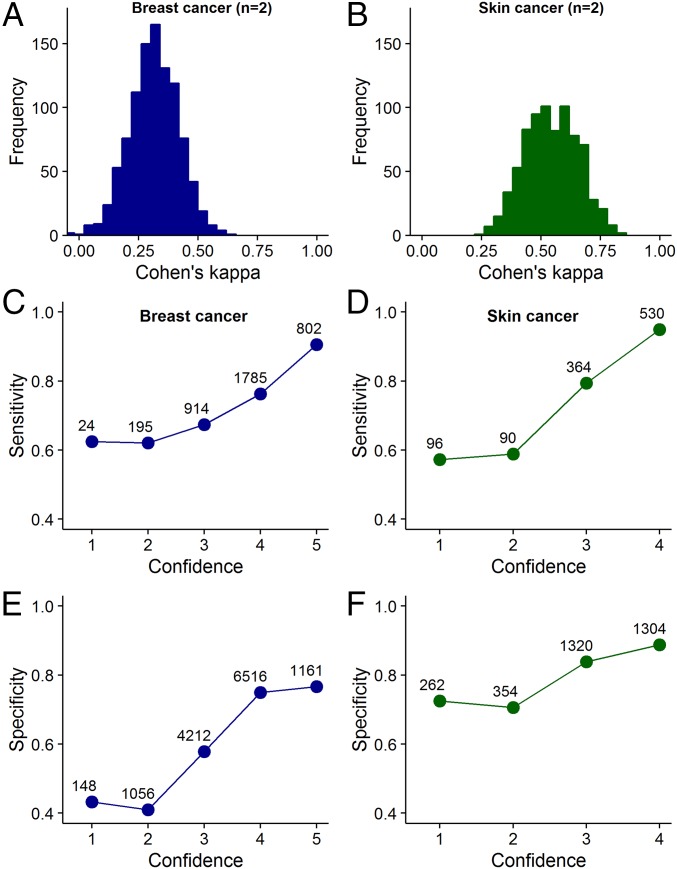
Fig. 1.
Two basic conditions underlying collective intelligence. (A and B) Frequency distribution of Cohen’s kappa values for unique groups of two diagnosticians, randomly sampled from our datasets. A kappa value of 1 indicates complete agreement of judgments among diagnosticians (i.e., identical judgments on all cases), whereas a kappa value of 0 or lower indicates low levels of agreement (i.e., few identical judgments). Although there is substantial variation in the kappa values between groups, overall, there is a substantial amount of disagreement among diagnosticians. SI Appendix, Fig. S2 shows that with decreasing kappa value, the ability of a group to outperform its best diagnostician increases. (C–F) Relationship between confidence and sensitivity/specificity. The more confident the diagnosticians were of their diagnosis, the higher were their levels of sensitivity (C and D) and specificity (E and F) in both diagnostic contexts. Symbol labels indicate the sample size. SI Appendix, Fig. S3 shows that this positive relationship between confidence and sensitivity/specificity holds for the best-performing, midlevel-performing, and poorest performing diagnosticians.

