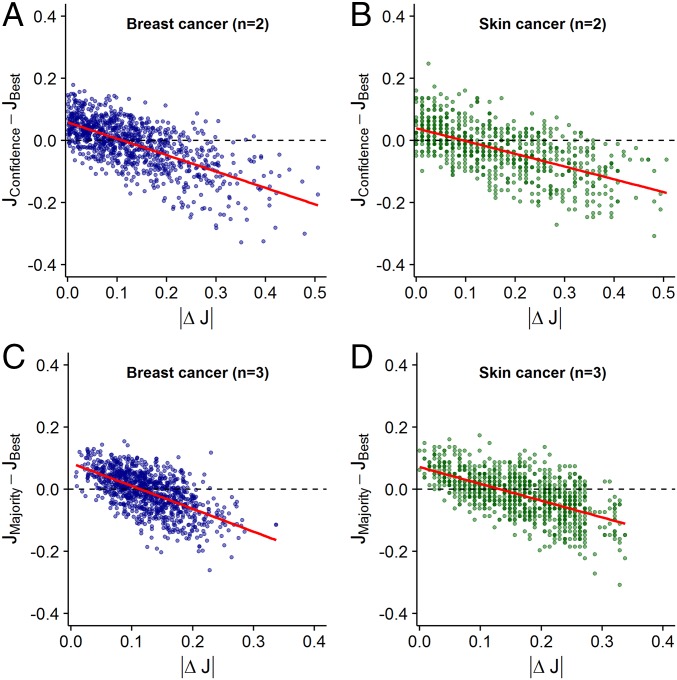
Fig. 2.
Performance difference between the confidence/majority rule and the best diagnostician in a group as a function of the difference in accuracy levels (i.e., |ΔJ|) between diagnosticians. Results are shown for groups of two diagnosticians using the confidence rule (A and B) and for groups of three diagnosticians using the majority rule (C and D). Each dot represents a unique combination of two (or three) diagnosticians. Values above 0 indicate that the confidence/majority rule outperformed the best individual in the group. Values below 0 indicate that the best individual outperformed the confidence/majority rule. Red lines are linear regression lines. In both breast cancer (A and C) and skin cancer (B and D) diagnostics, the confidence/majority rule outperformed the best individual only when the diagnosticians’ accuracy levels were relatively similar (|ΔJ| < 0.1).

