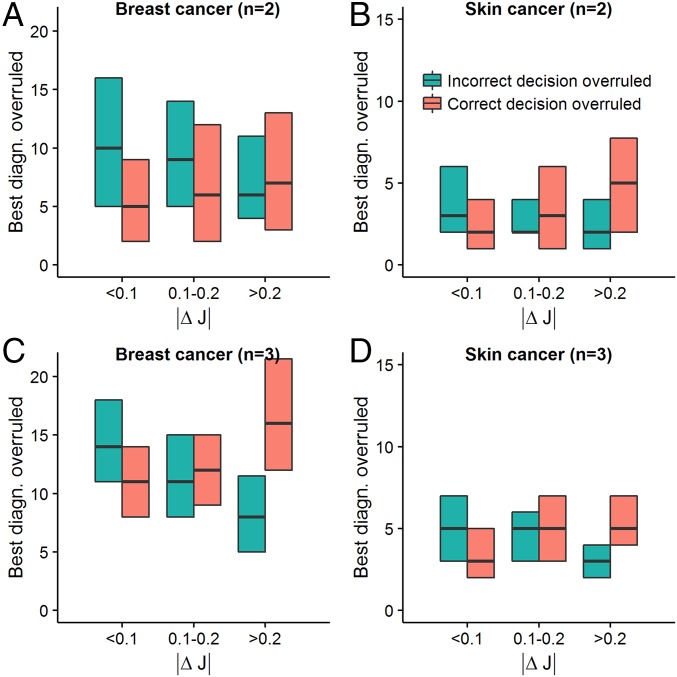
Fig. 4.
Number of correct/incorrect decisions of the best diagnostician overruled by the confidence/majority rule as a function of the difference in accuracy levels between diagnosticians. Green box plots correspond to the number of cases where an incorrect decision of the best diagnostician (diag.) within a group was overruled by the more confident diagnostician (A and B) or the majority (C and D). Red box plots correspond to the number of cases where a correct decision of the best diagnostician within a group was overruled by the more confident diagnostician (A and B) or the majority (C and D). Shown are averaged values based on (maximally 1,000) randomly drawn unique groups, using either of the two collective intelligence rules. Box plots show medians and interquartile ranges. As predicted from our modeling analysis (SI Appendix), with decreasing similarity in accuracy levels (i.e., higher |ΔJ|), the number of incorrect decisions by the best individual that were overruled decreased and the number of correct decisions by the best individual that were overruled increased.

