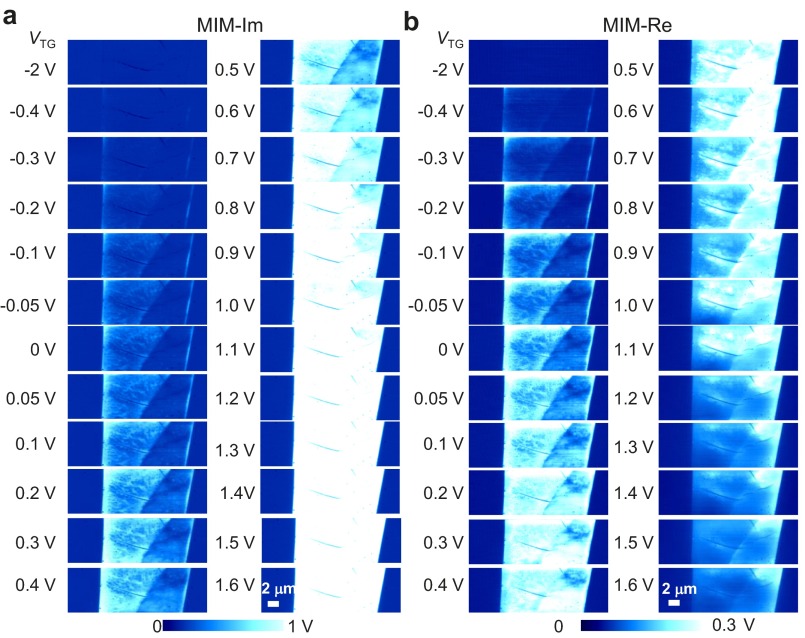
Fig. S2.
MIM images at different top-gate voltages. (A) MIM-Im and (B) MIM-Re images on the same area of the device as in Fig. 2A. The features are similar to that of the back-gated data. As VTG increases from −2 V to 1.6 V, MIM-Im signals increase monotonically, whereas MIM-Re signals reach a peak around VTG = 1.5 V and then diminish. The bright edges are also observed at low VTG before the bulk becomes conductive. Significant electrical inhomogeneity is visualized, as well, before the saturation of MIM signals.

