Fig. S4.
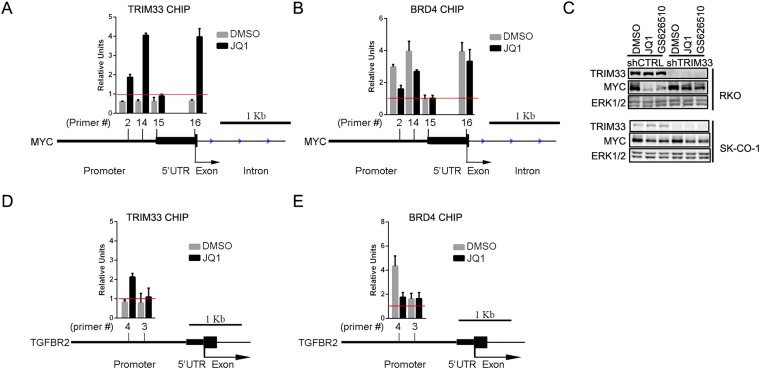
(A and B) ChIP at MYC gene promoter region. Red line threshold indicates IgG control level. (A) TRIM33 ChIP PCR using four different primer pairs (#2, #14, #15, and #16) in the MYC promoter region. (B) BRD4 ChIP PCR using the same set of primers as in A. (C) shCTRL or shTRIM33-transduced RKO and SK-CO-1 cells were treated with 1 μM of JQ1 or 0.3 μM of GS626510 for 24 h. MYC levels were determined by immunoblotting and ERK1/2 was used as a loading control. (D and E) ChIP at the TβRII gene promoter region. Red line threshold indicates IgG control level. (D) TRIM33 ChIP PCR using two different pair of primers (#4 and #3) amplifying the TβRII gene promoter region (E) BRD4 ChIP PCR, using the same set of primers as in D, amplifying the TβRII gene promoter region.

