Fig. 5.
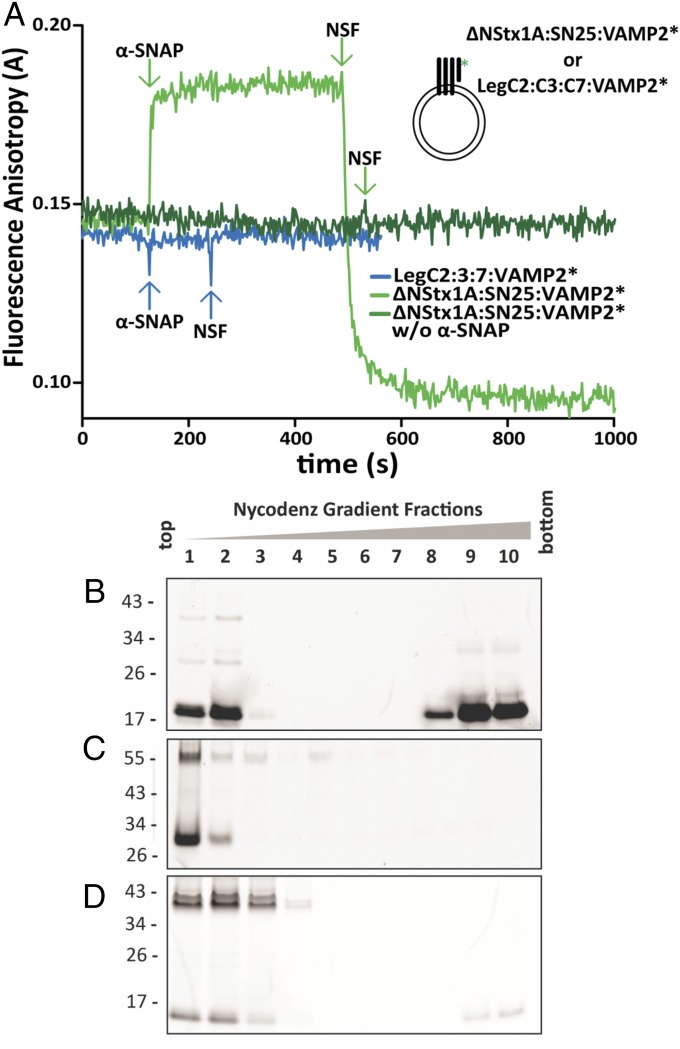
LegC–R-SNARE complexes are resistant to NSF-mediated disassembly. (A) Binding of α-SNAP and disassembly by NSF monitored by fluorescence anisotropy of labeled, cytoplasmic Syb (VAMP2*) reconstituted on SUVs with neuronal Q-SNAREs or LegCs. As positive control, sequential addition of α-SNAP (500 nM) and NSF (60 nM) to the truncated, ternary neuronal SNARE complex, led to expected rise and fall in anisotropy, respectively (light green trace). In the absence of α-SNAP, the same complex showed no change in anisotropy upon NSF addition (dark green trace). There was no change in anisotropy upon addition of α-SNAP and NSF to the LegC–VAMP2* hybrid complex, indicating that α-SNAP does not bind the complex, preventing binding of NSF (blue trace). For all SUVs, the protein:lipid (molar ratio) was 1:1,000. For purity of the recombinant proteins see Fig. 4A. (B–D) Proteoliposomes (as in A) reconstituted with truncated ternary neuronal SNARE complexes or LegC–VAMP2* hybrid complexes were incubated with α-SNAP, NSF, Mg+2, and ATP for 10 min followed by loading the samples on the bottom of a Nycodenz density gradient. After ultracentrifugation, the liposomes are enriched in the Top fractions of the gradient, whereas proteins not associated with membranes remain at the Bottom. The fractions were resolved by SDS/PAGE and the Oregon-Green–labeled, cytoplasmic Syb (VAMP2*) was detected in gel by a fluorescence imager. (B) In proteoliposomes containing the neuronal SNARE complexes, the majority of the VAMP2* was released and remained at the bottom of the gradient. Part of the unassembled VAMP2* seen in the Upper fractions illustrates the successful reconstitution of the complex on liposomes. (C) Identical to B, but ATP was replaced with its analog ATPγS. No dissociation of VAMP2* was detectable. Furthermore an SDS-resistant band of approximately 55 kDa is visible as expected for a truncated ternary neuronal SNARE complex. (D) For proteoliposomes containing the LegC–VAMP2 hybrid complexes, VAMP2* was not released (note that the weak signal on the bottom of the gradient represent the excess VAMP2* that did not form the complex). In addition, prominent SDS-resistant bands of higher Mr are detectable, representing nondissociated complexes.

