Fig. 1.
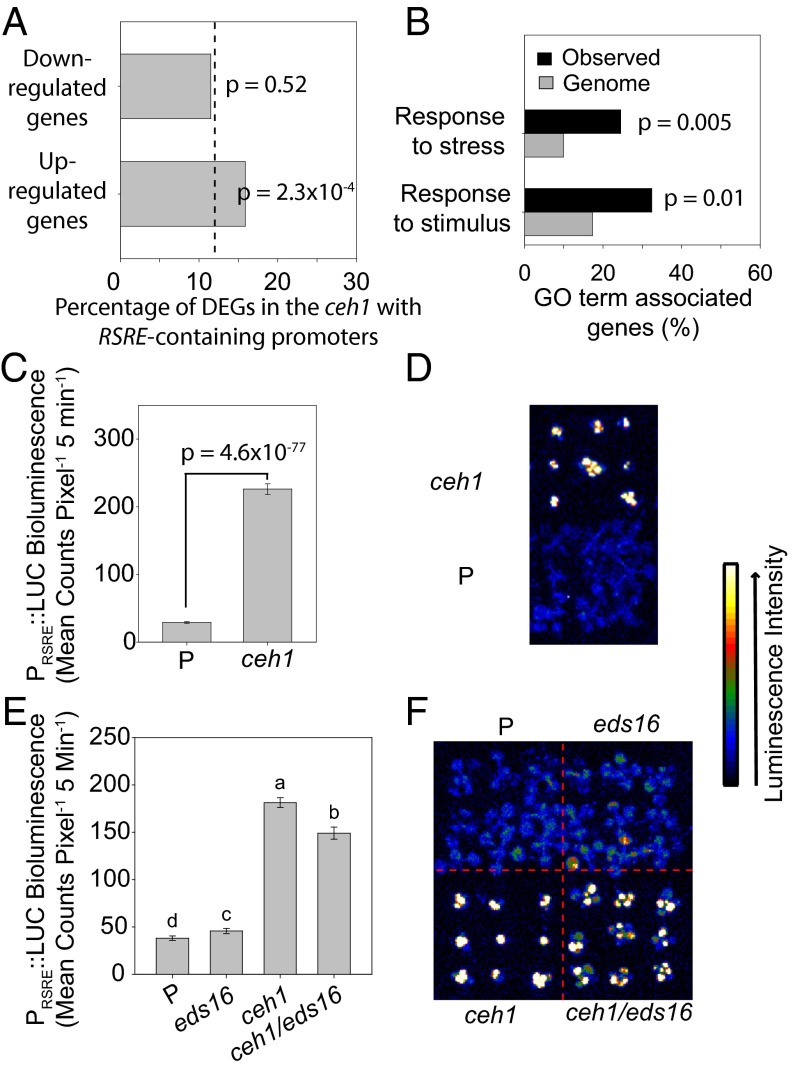
The constitutive activation of GSR is specific to the ceh1 and does not depend on SA. (A) Proportion of DEGs in the ceh1 mutant containing an RSRE in the proximal 500 bp of the promoter region. The dashed line represents the proportion of genes on the ATH1 genome array with RSRE-containing promoters. P values were determined via the hypergeometric distribution. (B) Enrichment of selected GO terms in RSRE-containing genes induced in ceh1 (observed); P values were determined using false-discovery rate (FDR)-corrected Fisher’s exact test. (C) Basal RSRE:LUC activity in parent (P) and ceh1 seedlings. Data are presented as means ± SEM (n ≥ 123) with the P value determined using a two-tailed Student’s t test. (D) Representative darkfield images of P and ceh1 plants expressing RSRE:LUC. (E) Basal RSRE:LUC activity in the listed genotypes. Data are presented as means ± SEM (n ≥ 123). Bars that do not share a letter represent statistically significant differences as determined by Tukey’s honestly significant difference (HSD) test (P < 0.05). (F) Representative darkfield images of plants of each genotype expressing RSRE:LUC. The color-coded bar displays the intensity of LUC activity.

