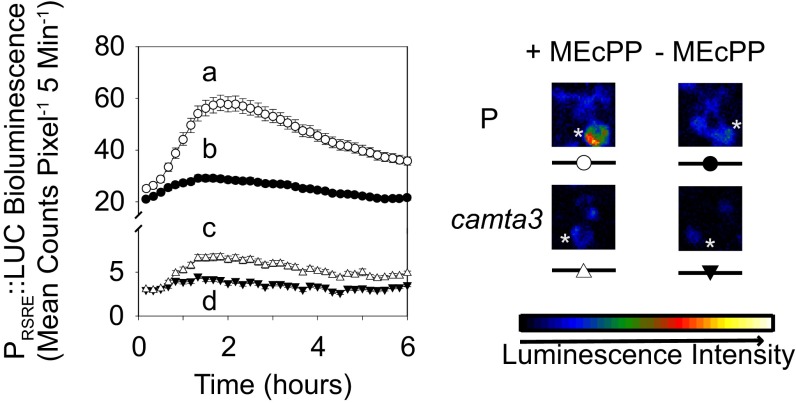
Fig. 4.
Exogenous application of MEcPP rapidly induces RSRE via CAMTA3. (Left) Activity of RSRE:LUC in P (upper curves) and camta3 (lower curves) leaves following application of MEcPP (open circles and triangles) or water as the control (filled circles and triangles). Data are shown as means ± SEM (n ≥ 187). Lines that do not share a letter represent statistically significant differences as determined by Tukey’s HSD test at the 90-min time point (P < 0.05). (Right) Representative plants are shown at right, with the treated leaves labeled by a white asterisk. The color-coded bar displays the intensity of LUC activity.

