Fig. 5.
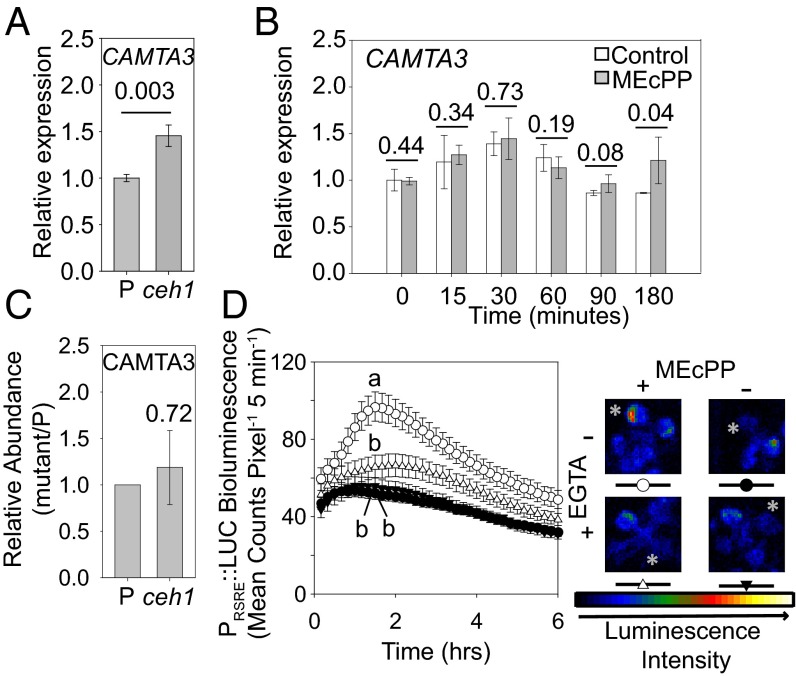
Activation of RSRE by MEcPP is Ca2+ dependent. (A) Relative expression levels of CAMTA3 analyzed by qRT-PCR in the P and ceh1 lines. Data are presented as means ± SEM (n = 3), with the P value determined by the two-tailed t test. (B) Relative expression levels of CAMTA3 analyzed by RT-qPCR in P plants at different times after the application of water (white bars) or MEcPP (gray bars) to the leaves. Data are presented as means ± SEM (n = 3). P values from one-tailed t tests are shown above each pair of bars. (C) Normalized iTRAQ CAMTA3 protein abundance in ceh1 plants relative to P plants. Data are presented as means with the P value determined by the two-tailed t test. (D, Left) Activity of 4×RSRE:LUC in the P background following pretreatment with EGTA (triangles) or water (circles) and subsequent MEcPP application (open circles and triangles) or water as the control (filled circles and triangles). Data are shown as means ± SEM (n ≥ 111). Lines that do not share a letter represent statistically significant differences as determined by Tukey’s HSD test at the 90-min time point (P < 0.05). (Right) Representative plants are shown with the treated leaves labeled by a white asterisk. The color-coded bar displays the intensity of LUC activity.

