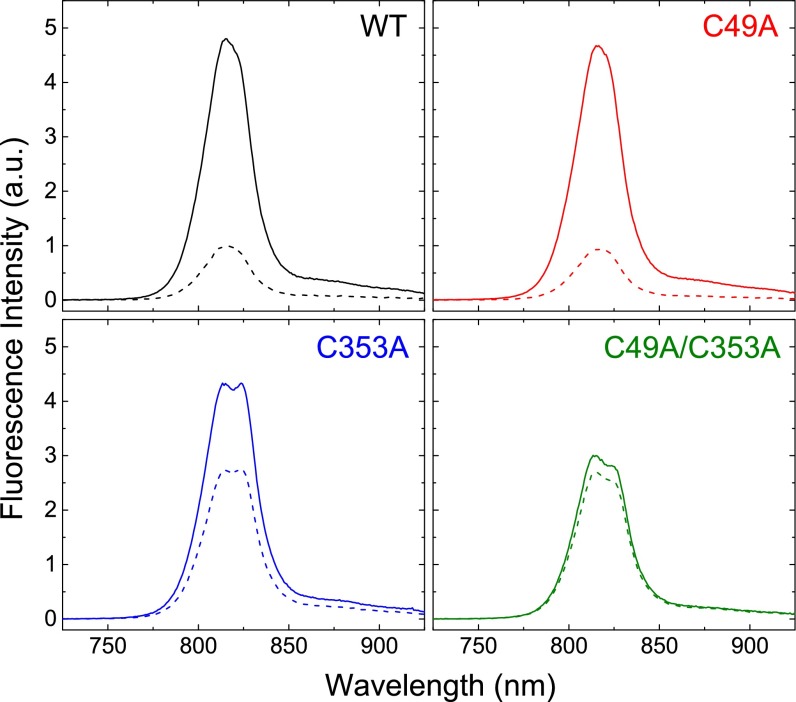
Fig. 3.
Fluorescence emission response of WT FMO and the C49A, C353A, and C49A/C353A mutants to excitation at 602 nm. All samples had identical absorbance levels (OD602 nm = 0.06) and were treated with the same amount of sodium dithionite (final concentration: 10 mM) so that all samples could be plotted on identically scaled axes for comparison. Dotted lines, air-oxidized solution; solid lines, dithionite-reduced solution.

