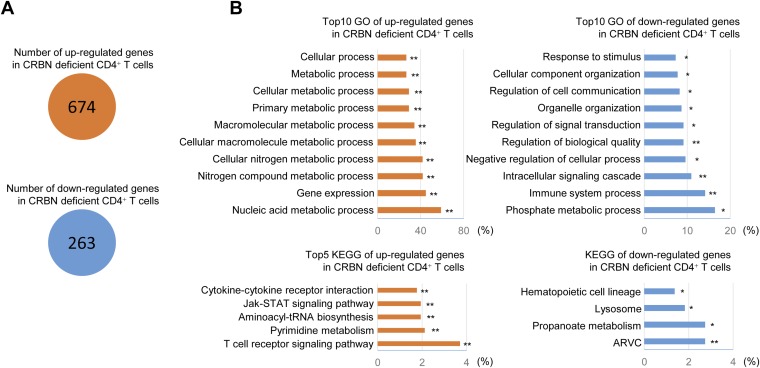
Fig. S5.
Differentially expressed gene analysis. (A) Total number of genes showing up- regulation or down-regulation in CRBN-deficient T cells. (B) Top 10 GO biological process categories involving up-regulated or down-regulated genes (Upper), and top five KEGG pathway categories involving up-regulated or down-regulated genes (Lower). All GO groups and KEGG groups demonstrated enhanced statistical representation (EASE score value <0.01). Bars represent the proportion of genes involved in each category, for which statistical significance and the number of genes is indicated. *P < 0.01; **P < 0.001.

