
Figure 2.
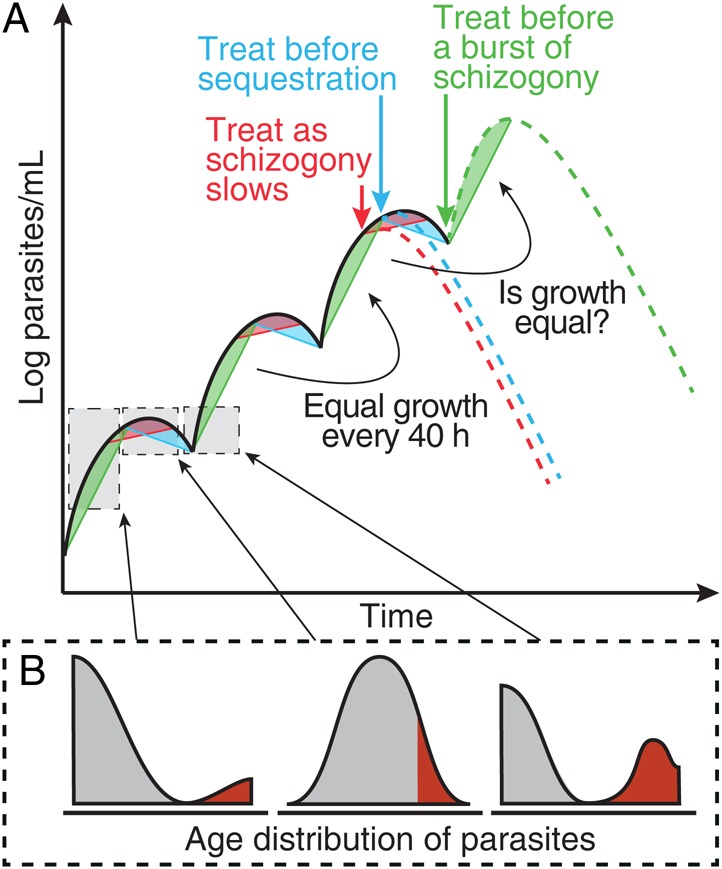
Illustration of the periodic growth cycle of parasitemia. A, A schematic of parasite growth in an individual with synchronous infection with Plasmodium falciparum. Parasites progress through their life stages synchronously, with a rapid increase every 40 hours following schizont rupture (green regions). Troughs occur every 40 hours as mature parasites sequester (blue regions). B, The expected age profile of parasite at each point in the life cycle, with gray shading indicating parasites in circulation and red shading indicates sequestered parasites. The green dashed line illustrates the hypothesis that individuals treated at a trough in parasite concentration (green arrow) tend to have an increase in parasite concentration immediately after treatment. Alternatively, individuals treated near a peak in parasite concentration (blue arrow) will tend to experience a decline in parasite concentration immediately after treatment. This figure is available in black and white in print and in color online.