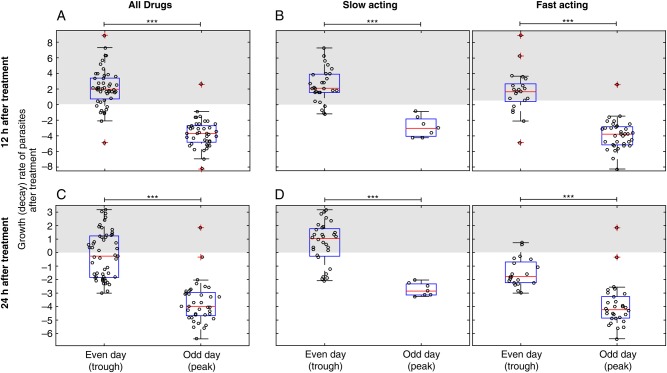
Figure 3.
Treatment at a peak or trough in parasitemia level. Changes in parasitemia level immediately following treatment among volunteers treated at different times after infection. Data are the aggregate of all available volunteers who were treated in the morning and for which necessary data were available. ***P < .0001, by a t test. A, Parasite numbers tended to increase in the first 12 hours after treatment in volunteers treated on an even day (n = 49; mean growth rate, 2.1/day). By contrast parasite numbers tended to decline in volunteers treated on an odd day (n = 41; mean growth rate, −3.7/day). B, This was true for subjects regardless of whether they received a fast-acting or slow-acting antimalarial. C, Parasite numbers were more likely to decline in the first 24 hours after treatment for those treated on an even day (n = 53; mean, −0.19/day), but the decline was still greater for those treated on an odd day (n = 37; mean, −3.17/day). D, Only those subjects treated on an even day with a slow-acting antimalarial experienced a rise in parasitemia level after treatment on average.

