Figure 4.
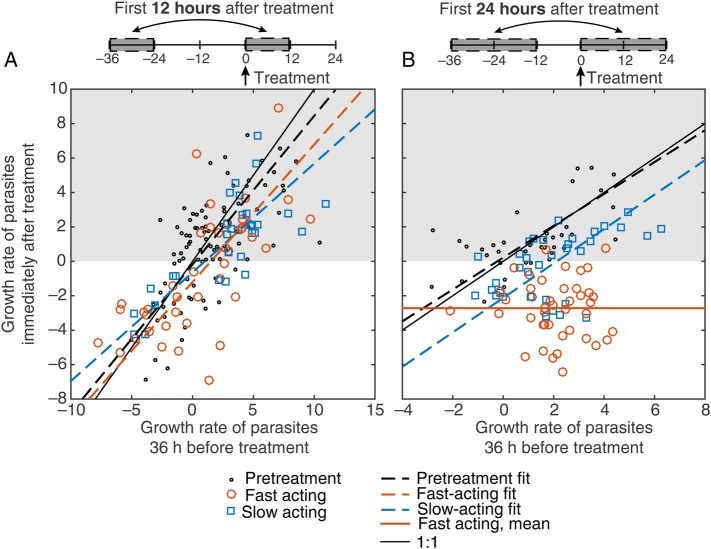
Predicted versus observed growth rates. The action of slow-acting and fast-acting drugs in the first 12 hours (A) and 24 hours (B) after treatment. The expected growth rate (growth rate 36 hours before treatment) is shown on the x-axis, and the observed growth rate (growth rate at the time of treatment) is shown on the y-axis. Red points indicate subjects who received a fast-acting drug, and blue points indicate subjects who received a slow-acting drug (subjects from mefloquine cohort 1 and OZ439 cohort 1 were excluded from this analysis because they received noncurative doses). Growth rates were calculated over a 12-hour window (A) and a 24-hour window (B), using a 2-point method, as illustrated schematically above each panel. Pretreatment growth rates are shown (black dots) for all patients for whom parasite growth rates were available 12 hours before treatment (from −12 hours to 0 hour) and 1 cycle earlier (−48 hours to −36 hours; A) and 24 hours before treatment (−24 hours to 0 hour) and 1 cycle earlier (−60 hours to −36 hours; B). A linear regression model of the relationship between expected growth and observed growth for pretreatment data (black dashed line), fast-acting drugs (red dashed line), and slow-acting drugs (blue dashed line) are shown (using Deming regression). The solid red line in panel B indicates the mean growth rate after treatment, since the slope of the regression for this group was not significant. This figure is available in black and white in print and in color online.

