
Fig 4. Structural connectivity preprocessing.
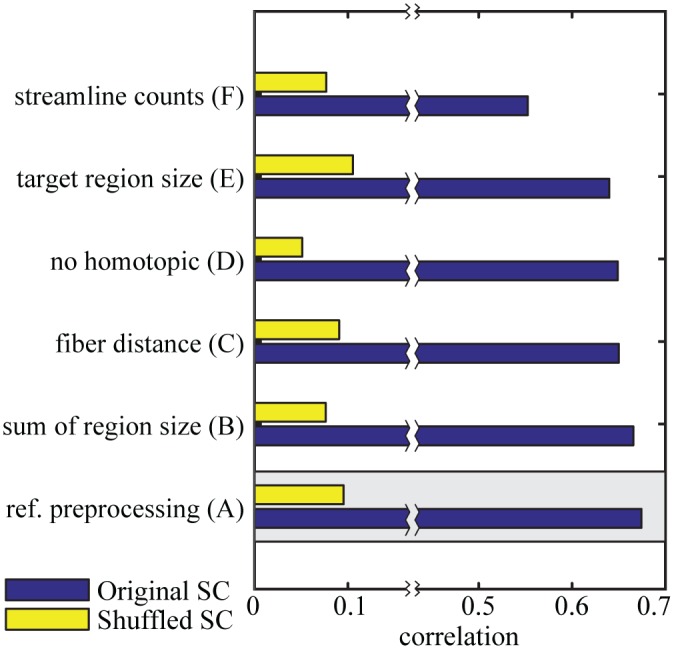
The correlation between modeled and empirical functional connectivity for different preprocessing steps of structural connectivity. In the reference procedure, the number of tracked fibers between two regions was normalized by the product of the region sizes. The model based on the original structural connectivity is shown in blue and the baseline model which is based on shuffled structural connectivity in yellow. The gray box marks the reference procedure.