
Fig 7. Source reconstruction.
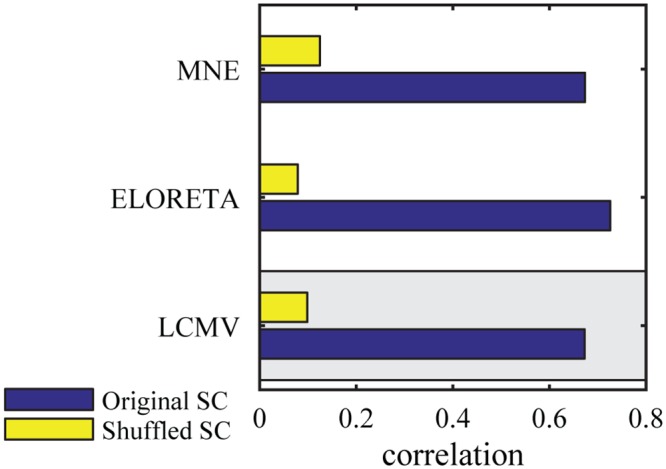
The correlation between modeled and empirical functional connectivity for different source reconstruction algorithms. The model based on the original structural connectivity is shown in blue and the baseline model which is based on shuffled structural connectivity in yellow. The gray box marks the reference procedure.