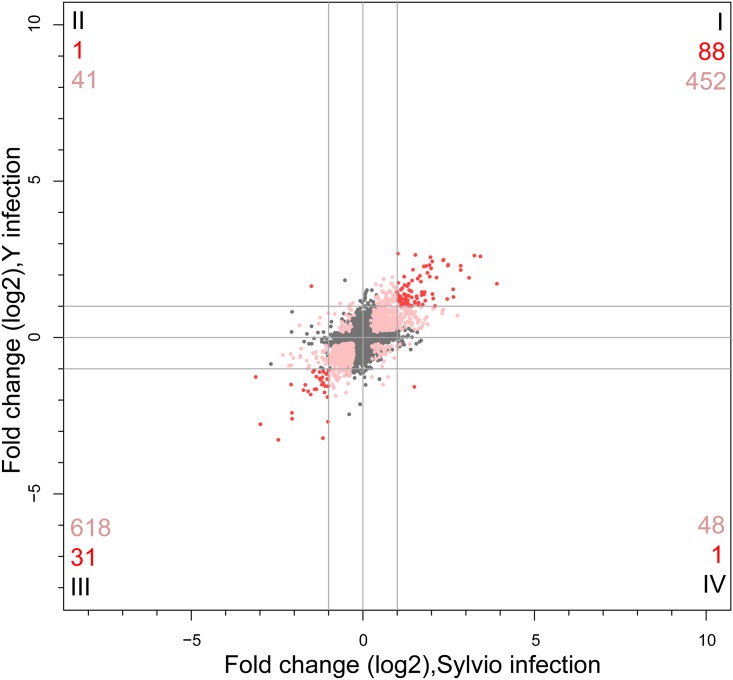
Fig 4. Comparative analysis of T. cruzi parasite Sylvio versus Y strain transcriptome response.
Scatterplot of log2 fold change in expression of a subset of orthologous T. cruzi parasite genes in Sylvio (x-axis) versus Y strain (y-axis) at 24 hpi versus 4 hpi. Genes that were not significantly differentially expressed are shown as gray dots. Pink dots represent genes that were significantly DE in both strains of parasite but had log2 FC in one or both strains that was below our cutoff value of 1. Red dots depict genes that were significantly DE and had absolute value of log2 FC>1 in both strains. The numbers in each quadrant correspond to the total number of significantly DE genes that met the log2 FC cutoff of 1 (red) or were significantly DE but did not meet the FC cutoff (pink).

