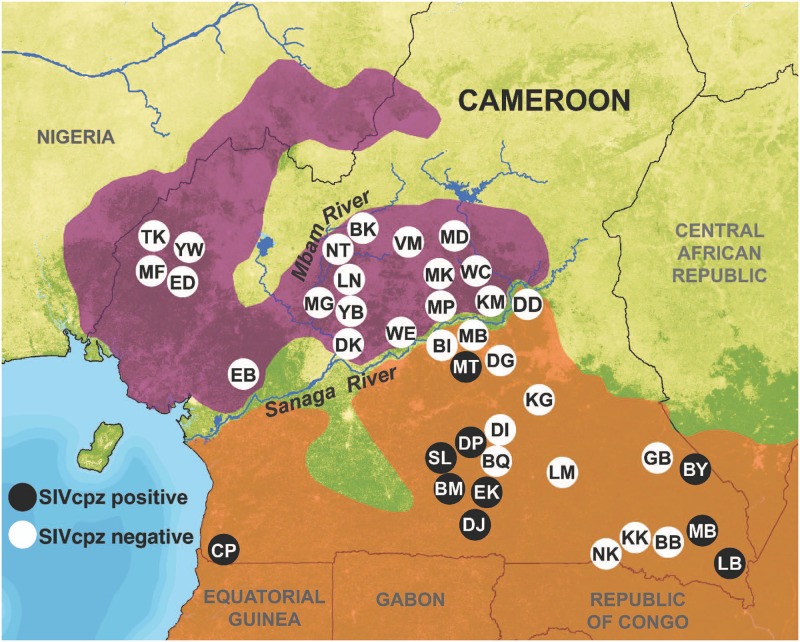
Fig 2. Chimpanzees sample locations.
The locations are plotted against the distributions of P. t. ellioti (purple) and P. t. troglodytes (orange). SIVcpz positive locations are shown in black and SIVcpz negative locations are shown in white. The map background layer is “percent tree cover” from the MODIS satellite [81]. Rivers are from the HydroSHEDS hydrography layer [82].

