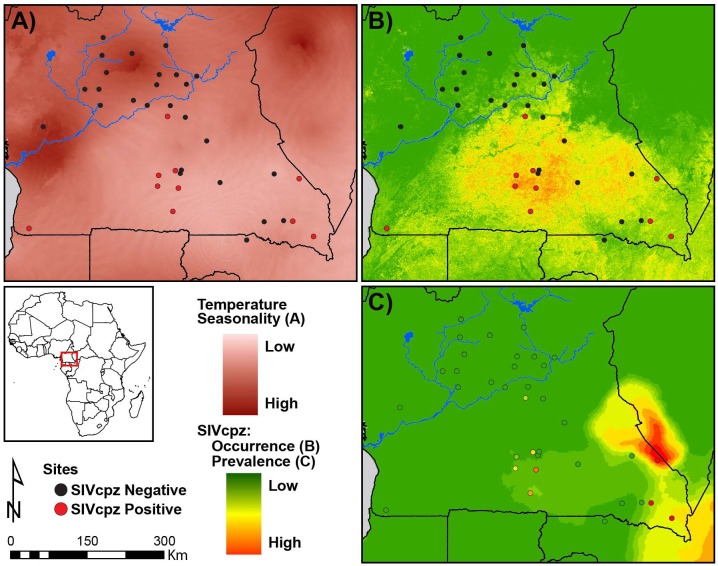
Fig 4. SIVcpz predictions of occurrence and prevalence across Cameroon.
(A) Temperature Seasonality, (B) SIVcpz occurrence calculated using Maxent [41], (C) SIVcpz prevalence calculated using randomForest [48]. SIVcpz positive sites are shown in red and SIVcpz negative sites are shown in black in A and B. Circles in C correspond to prevalence according to the color ramp to the left.

