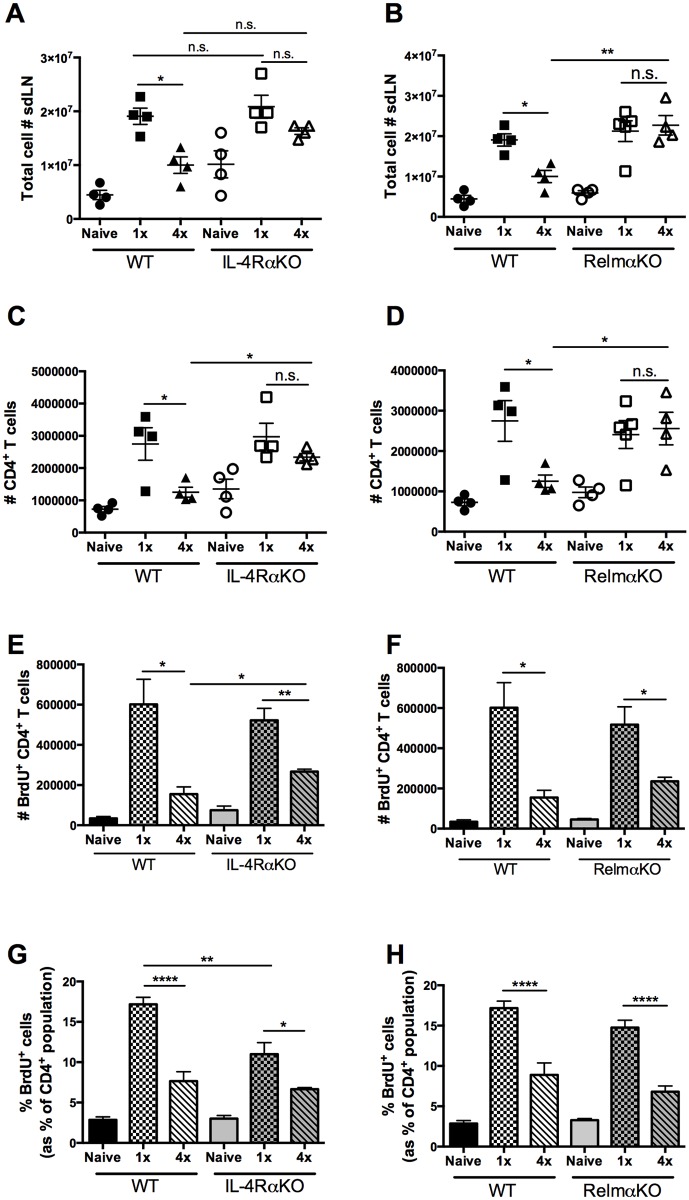
Fig 4. Increased CD4+cellularity of sdLN from 4x infected mice in the absence of IL-4Rα and RELMα but not a reversal of CD4+ cell hypo-responsiveness.
Number of A & B. total cells, and C & D. CD4+ T cells in the sdLN of naïve, 1x and 4x infected WT, IL-4RαKO, and RelmαKO mice. E & F Number of CD4+ BrdU+ cells, and G & H. percentage of CD4+ T cells that are BrdU+ in the sdLN of naïve, 1x and 4x infected WT mice compared to IL-4RαKO and RelmαKO mice. Symbols are values for individual mice; horizontal bars are means ±SEM (n = 4–5 mice per group). n.s. denotes ‘not significant’ p>0.05; * = p<0.05; ** = p<0.01; *** = p<0.001; **** = p<0.0001 as determined by ANOVA and Tukey’s post-test analysis, or Student’s t test.

