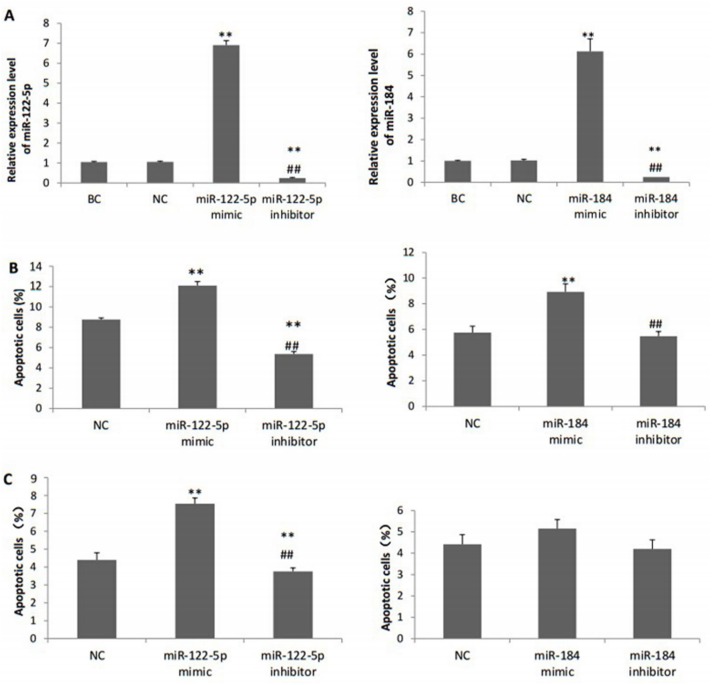
Fig 5. The apoptosis ratio detected by flow cytometry after transfection.
(A) Relative expression levels of miR-122-5p and miR-184 after transfection. (B) Percentage of apoptotic cells after H2O2 treatment. (C) Percentage of apoptotic cells without H2O2 treatment. BC, blank control group; NC, negative control miRNA group.

