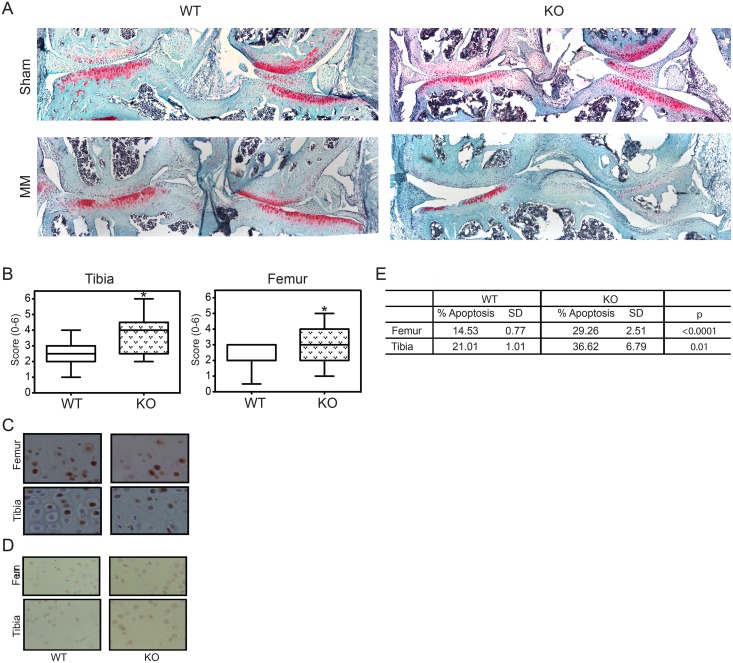
Fig 4. Osteoarthritis susceptibility.
(A) 25x magnification view of knee joints from WT and KO mice after sham operation or medial meniscectomy (MM). (B) Box and whiskers plot of histologic scoring of medial tibial and femoral surfaces for OA. *p = 0.0206 for tibia, p = 0.0003 for femur, n = 18 WT and 17 KO. Representative photomicrographs of TUNEL staining of articular surfaces at 1 week after knee destabilization in the injured (C), and sham operated (D) knees. Apoptotic cells seen in the same area of the articular cartilage were counted at 200x magnification as shown and quantified (E). *p<0.001 for femur and p<0.00001 for tibia, n = 5 WT and 6 KO.

