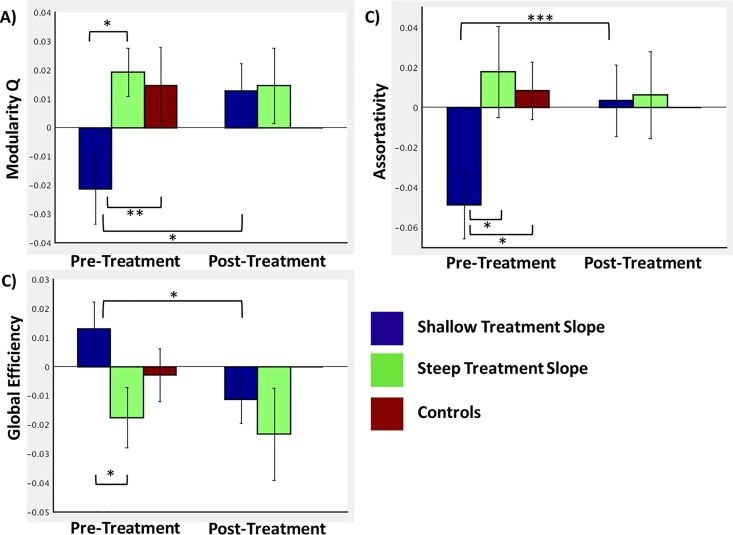
Fig 2.
Bar graphs comparing the network organization indices of modularity (panel A), global efficiency (panel B), and assortativity (panel C) between patients with steep (n = 10) and shallow (n = 10) treatment responses. The pre-treatment comparisons additionally include the mean network indices for a healthy comparison group of 15 adolescent girls. Error bars indicate standard errors. * indicates p < .05; ** indicates p = .076; *** indicates p = .059.

