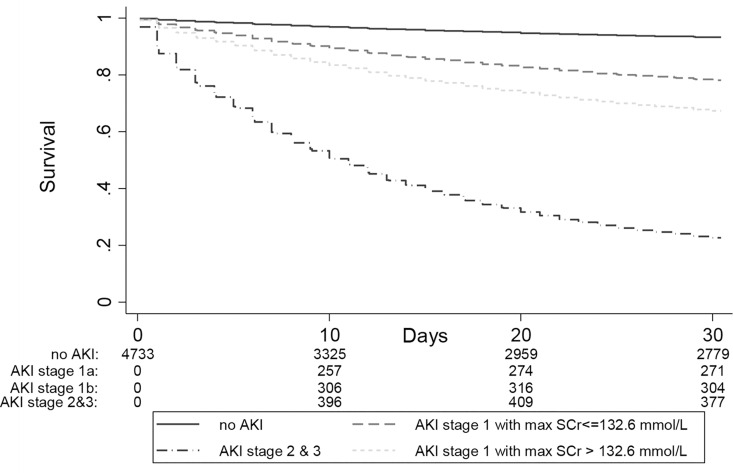
Fig 5. 30-day mortality according to AKI with or without Scr >132.6 mmol/l.
The numbers at the bottom of the survival curves represent the number of patients at risk in each AKI and renal recovery group at various time points. (AKI stage 1a: AKI stage 1 with max SCr< = 132.6 μmol/L; AKI stage 1b: AKI stage 1 with max SCr>132.6 μmol/L)

