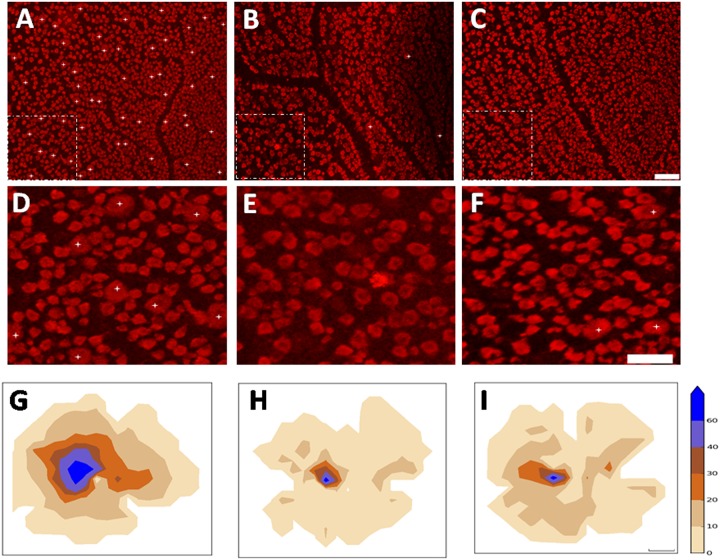
Fig 6. Number and density distribution of RBPMS-alpha RGCs under different experimental conditions.
A-C show retinal micrographs taken 1 mm temporal to the AC in the superior retina. A: Normal, B: ONC, C: ONC+ALA. Scale bar: 100 μm. D-F show magnified areas in the panels above (dashed line enclosed areas). Asterisks denote alpha cells. Scale bar: 100 um. Bottom panels provide alpha cell isodensity distribution maps under different experimental conditions. G: Normal (n = 3), H: ONC (n = 3), and I: ONC+ALA (n = 4). Color scale ranges from 0 (camel) to 60 or higher RGCs/ mm2 (navy blue): 0–10 –camel; 11–20 –desert dune; 21–30 –light brown; 31–40 –brown; 41–60 –light blue, 61 and up—navy blue. Scale bar: 2 mm.

