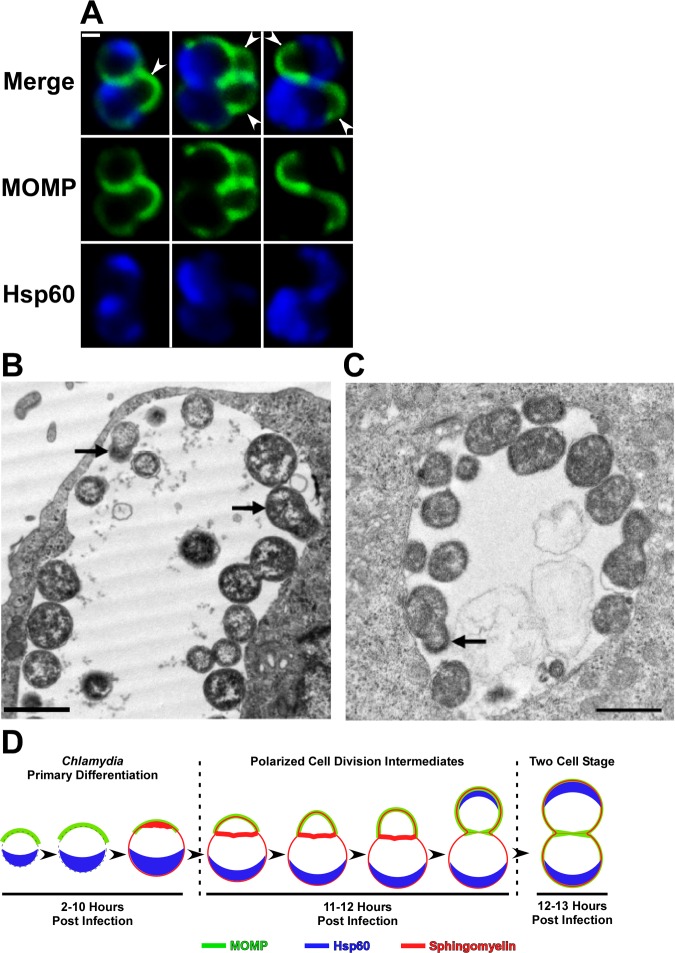
Fig 4. Confocal and EM analysis of the polarized cell division process of C. trachomatis serovar L2.
(A) HeLa cells were infected with C. trachomatis and fixed at 13 hours post-infection. Following permeabilization, the cells were incubated with rabbit polyclonal antibodies against Hsp60 (blue) and goat polyclonal antibodies against MOMP (green) followed by goat anti-rabbit IgG conjugated to Alexa Fluor 633 and donkey anti-goat IgG conjugated to Alexa Fluor 488 secondary antibodies. The cells were then washed prior to confocal analysis. Arrowheads in A point to sites of polarized growth in cells undergoing the second round of division. (B and C) Alternatively, cells were fixed at 17 hours post-infection and processed for transmission electron microscopy. Black arrows in B and C point to cells undergoing polarized cell division. (D) Model depicting the morphological changes that occur during the primary differentiation and the initial cell division of C. trachomatis are illustrated. The localization of MOMP (green), Hsp60 (blue), and sphingomyelin (red) is shown. The distribution of sphingomyelin has not been determined in the two earliest intermediates in this model (left hand side of D). The chlamydial membrane is depicted by a dashed line in these intermediates. White bar in A is 0.5μ. The black bars in B and C are 1μ.

