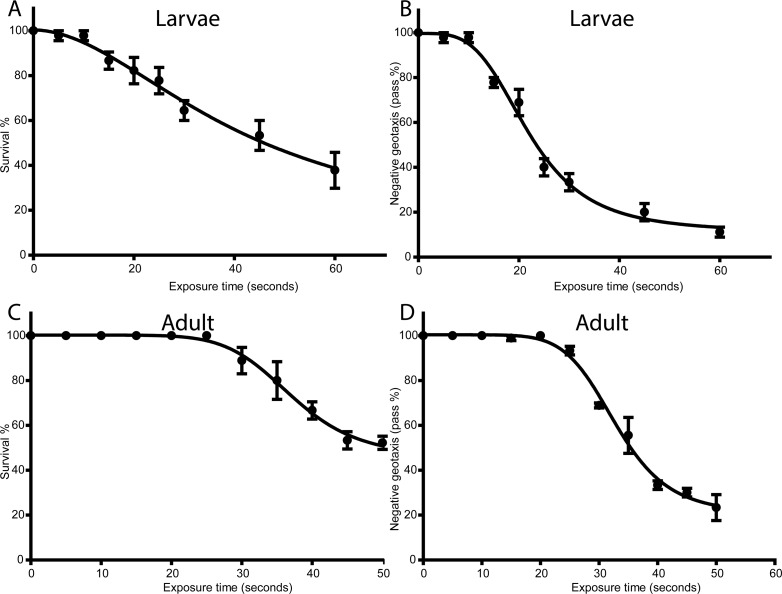
Fig 2. Standardization of non-thermal plasma doses in Drosophila.
A and C: Graphs represent percentage of treated larvae or adults (A and C, respectively) survived at different time of 50 Hz treatment. B and D: Graphs represent negative geotaxis assay performed after 50Hz treatment of larvae after turning into adults and adults after 2 days after treatment.

