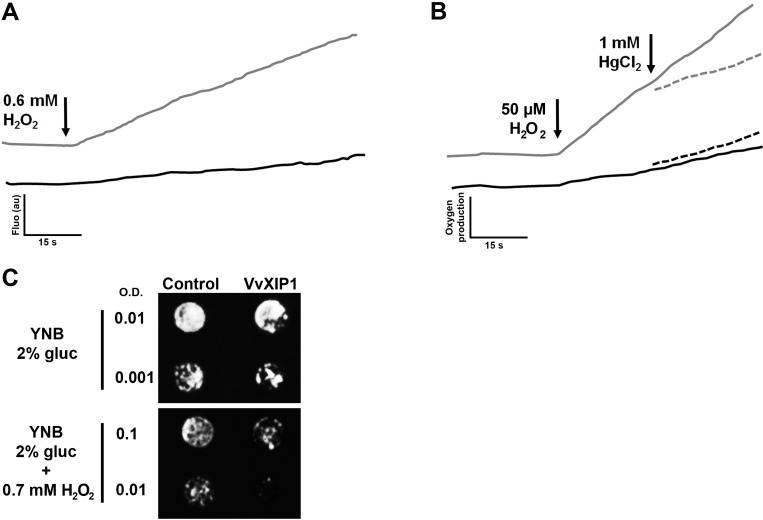
Fig 3. H2O2 transport by yeast cells expressing VvXIP1.
Yeast cultures transformed with pVV214-VvXIP1 (black line) and control cells (empty vector, grey line) were incubated overnight with the CM-H2DCFDA probe and fluorescence increase after the addition of 0.6 mM H2O2 was monitored in a spectrofluorimeter (A). O2 release (after the intracellular breakdown of H2O2) by cells transformed with pVV214-VvXIP1 (black) and control yeast (grey) monitored with a Clark electrode in response to 50 μM H2O2 (solid lines) and after mercury inhibition (dashed lines) (B). Plate growth assays in YNB media supplemented with 0.6 mM H2O2 (C).

