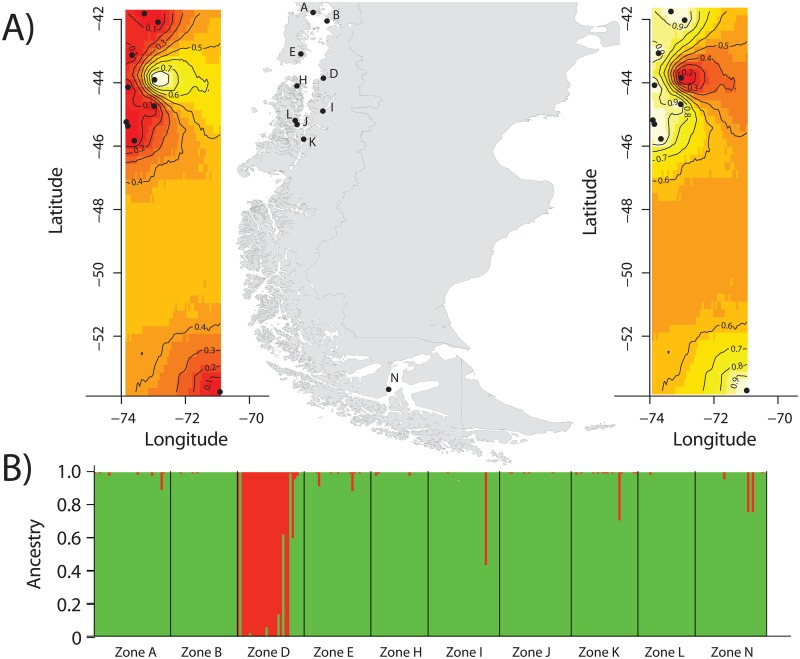
Fig 2. Bayesian clustering results from STRUCTURE and GENELAND.
A) Plot shows the most likely number of clusters for the dataset. GENELAND analyses with posterior probability isoclines denoting the extent of genetic landscapes. Clusters indicated by GENELAND: B) Largest Cluster (LC) and C) Smallest Cluster (SC). Black dots represent localities analyzed in this study (represented by its respective letter) and regions with the greatest probability of inclusion are shown in white, whereas diminishing probabilities of inclusion are proportional to the degree of coloring.

