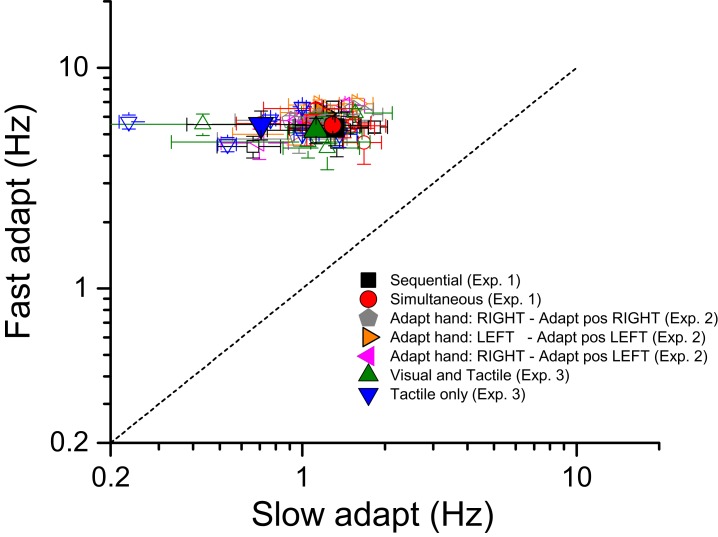
Figure 5. Tapping rates for high and low adaptation.
Tapping rates (open symbols for single subject data; filled symbols for averages) for two different adaptation conditions: fast adaptation (ordinate) and slow adaptation (abscissa) for seven different experimental conditions. Black and red refers the two conditions in which subjects tapped in mid-air and then estimated numerosity of either sequential or simultaneous visual stimuli respectively. Gray, orange and violet refer to the three different versions of the simultaneous conditions devised to investigate the reference frame of adaptation: gray - subjects tapping with the right hand on the right side, orange - left hand on the left side and purple -right-hand on the left side. The adapting conditions in which subjects tapped on a surface (receiving tactile feedback) are indicated by green and blue symbols: green refers to the ‘visual and tactile’ condition in which participants tapped on touch-screen surface and were provided with visual feedback of their moving hand (visible) as well as by flashes on the monitor signaling the contact between the finger and the touch screen. Data in blue refer to the ‘tactile only’ condition in which subjects tapped on the mouse button placed beyond the screen (moving hand not visible).

