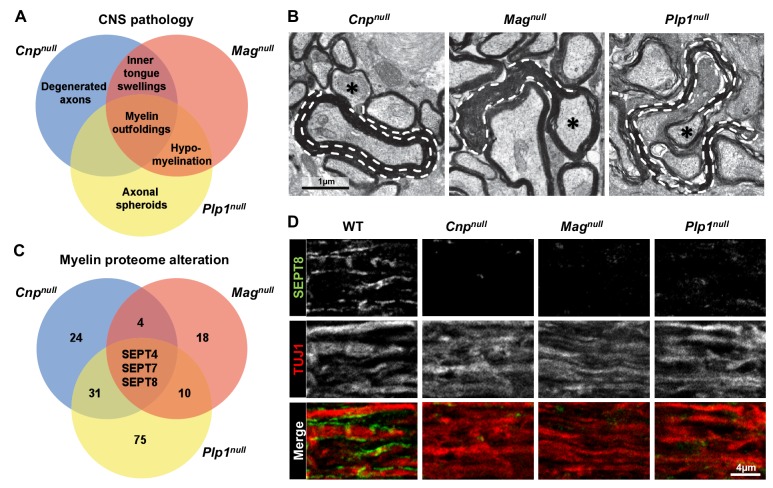
Figure 1. Mouse mutants with complex CNS pathology exhibit distinct but overlapping changes of myelin composition.
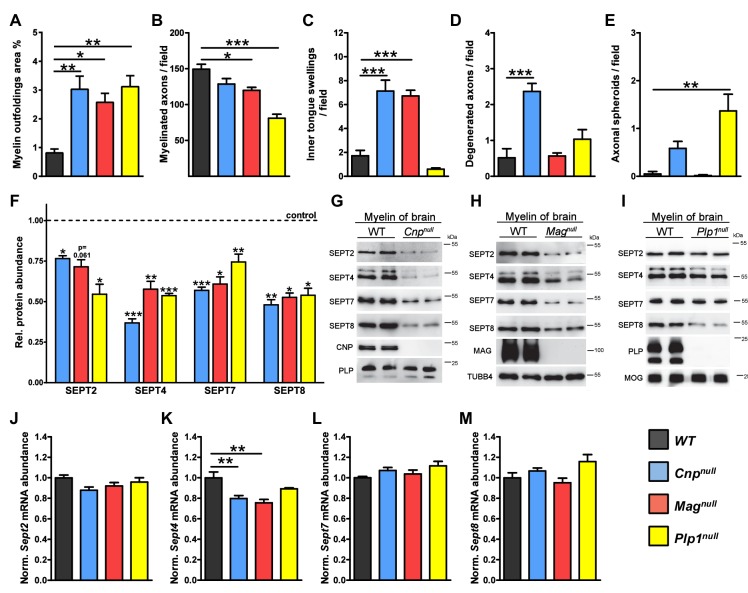
(A) Venn diagram summarizing CNS pathology in mice lacking the myelin proteins CNP, MAG, or PLP, according to quantitative evaluation of electron micrographs of optic nerves at P75. Note that myelin outfoldings are common to all analyzed mutants. See Figure 1—figure supplement 1A–E for quantification of these experiments. (B) Electron micrographs of P75 optic nerve cross-sections showing several myelinated axons. Myelin outfoldings and associated axons are labelled with stippled lines and asterisks, respectively. Images are representative of 4 animals per genotype, as quantified in Figure 1—figure supplement 1A. (C) Venn diagram summarizing myelin proteome alterations in Cnpnull, Magnull, and Plp1null-mice determined by quantitative mass spectrometry. Given are the numbers of proteins exhibiting significantly changed abundance in myelin purified from the brains of respective mutants at P75. Note that several septins are diminished in all analyzed mutants. n=3 animals per genotype. See Figure 1—source data 1 for entire dataset and Figure 1—figure supplement 1G–I for validation by immunoblot. (D) Immunolabelling validates diminishment of SEPT8 (green) in myelinated fibre tracts of Cnpnull, Magnull, and Plp1null-mice. Longitudinally sectioned optic nerves of P75 mice are shown. The axonal marker TUJ1 (red) was co-labelled as a control. Images are representative of three independent experiments.
DOI: http://dx.doi.org/10.7554/eLife.17119.003


