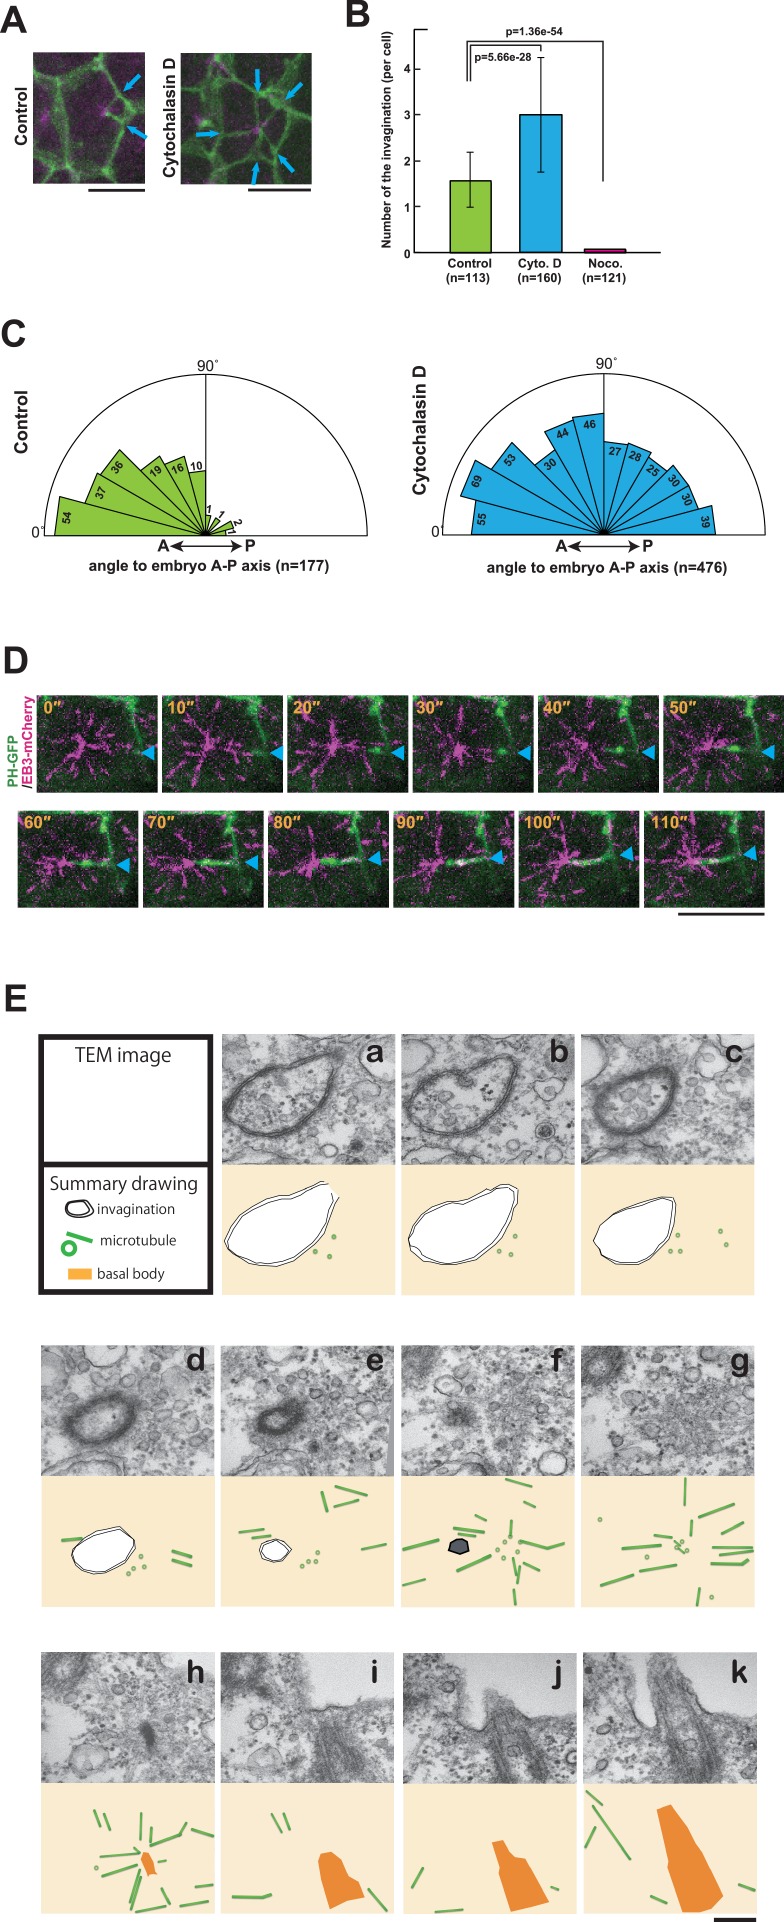
Figure 7. The role of cytoskeletal elements in the formation of the membrane invagination and the implication of microtubule function.
(A) Representative epidermal cells expressing PH-GFP/EB3-mCherry in control and cytochalasin-treated embryos. The cytochalasin panel is from Video 10. Blue arrows: membrane invaginations. Bars: 10 µm. Anterior: left. (B) The number of invaginations after inhibitor treatment: cytochalasin treatment (160 cells from three embryos) increased the number of invaginations, while nocodazole treatment (121 cells from three embryos) decreased the number of invaginations compared to control (113 cells from three embryos). Histograms are presented as the mean ± SD. p-values were obtained using the Welch's t-test. (C) In cytochalasin-treated cells, unlike normal cells, invaginations also formed from the anterior side and extended toward the posterior of the cell. We counted 177 and 476 invaginations, respectively, in three control and three cytochalasin-treated embryos. (D) A high time-resolution timelapse recording of a representative cell expressing PH-GFP/EB3-mCherry. A blue arrowhead indicates the membrane invagination. Time elapsed from the start of recording is shown in orange. Bar: 10 µm. Anterior: left. (E) A series of images from the serial TEM observation. TEM images (upper panels) and the corresponding schematic drawings (lower panels) are shown with the microtubules as green tubes, the membrane invagination as black double-line in a–e, or its tip as a hexagon filled by gray in f, and the basal body as an orange structure in h–k.

