Figure 2.
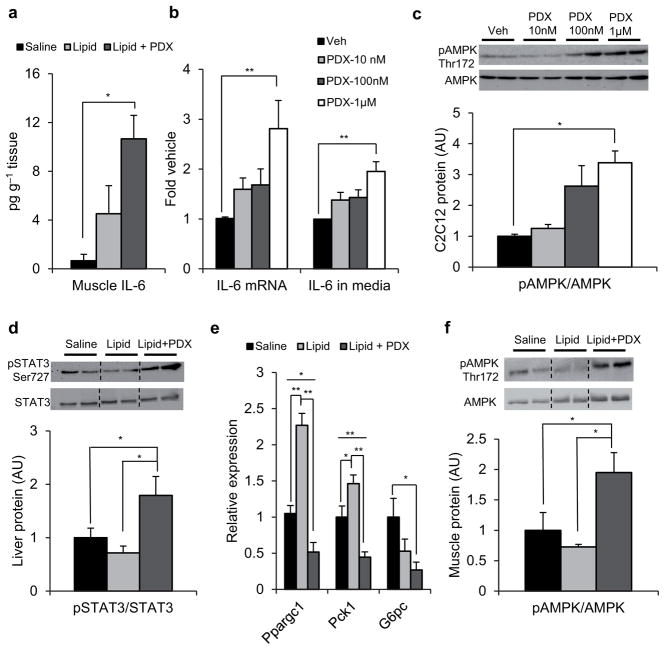
PDX stimulates skeletal muscle IL-6 expression. (a) Skeletal muscle IL-6 protein expression in gastrocnemius from clamped saline-vehicle, lipid-vehicle and lipid-PDX treated mice. Data are mean ± s.e.m., and are representative of 6 mice per group (b) Fold IL-6 mRNA expression normalized to GAPDH (left) and IL-6 protein secretion in media (right) and (c) immunoblots for pAMPK Thr172 and total AMPK in 2h PDX-treated C2C12 myotubes compared to veh control. Quantification of densitometry analyses for immunoblots is shown below the representative gels. Data are mean ± s.e.m. for three independent experiments (d) Immunoblots for pSTAT3 Ser727 and total STAT3 and (e) relative mRNA expression of Ppargc1, Pck1 and G6Pc normalized to GAPDH in liver from clamped saline-vehicle (n = 6), lipid-vehicle (n = 6) and lipid-PDX treated mice (n = 6). (f) Immunoblots for pAMPK Thr172 and total AMPK in gastrocnemius muscle from clamped saline-vehicle (n = 6), lipid-vehicle (n = 4) and lipid-PDX (n = 5) treated mice. Quantification of densitometry analyses for immunoblots is shown below the representative gels. Dotted lines indicate that lanes were run on the same gel but were noncontiguous. Data are mean ± s.e.m, * P<0.05, ** P<0.01 calculated using analysis of variance.

