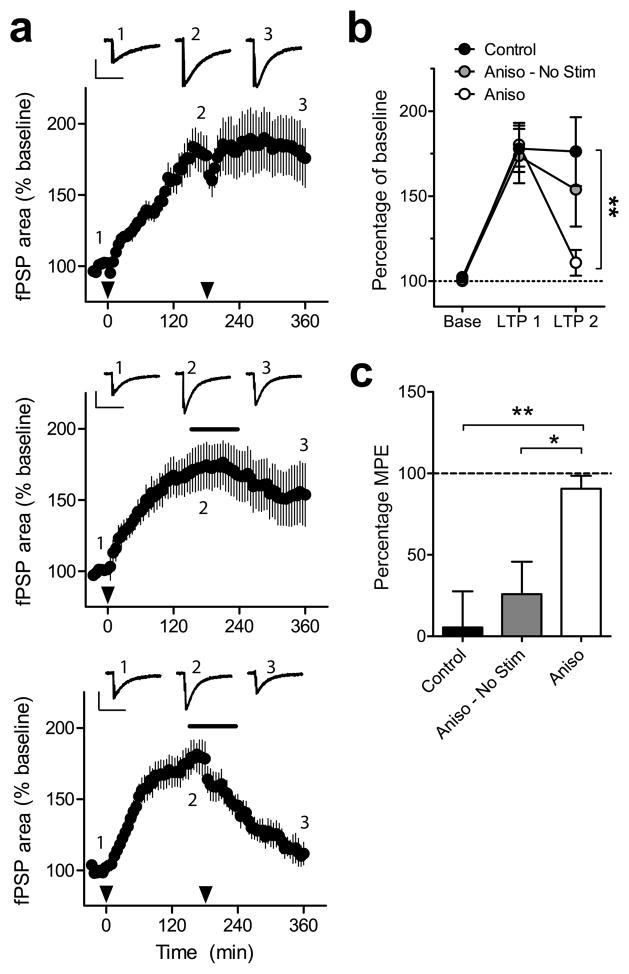
Figure 3.
LTP in SDH rendered labile after repeated stimulation. (a) LTP of fPSPs induced by 2 Hz stimulation (2 min; black arrows) followed by either a second stimulation at 180 min (top), application of anisomycin (Aniso; black bar) without stimulation (middle), or stimulation and anisomycin (bottom). Insets show representative traces from one experiment at baseline (1), 180 min (2) and 360 min (3). Inset scale bars indicate 0.2 mV (vertical) and 500 ms (horizontal). (b) Summary of LTP results. (c) Reversal of LTP measured at 180 min and 360 min expressed as a percentage of maximum possible effect (MPE). n = 9 experiments from 5 mice per group, * and ** indicates P < 0.05 and P < 0.01, respectively. All data are mean ± s.e.m.

