Figure 4.
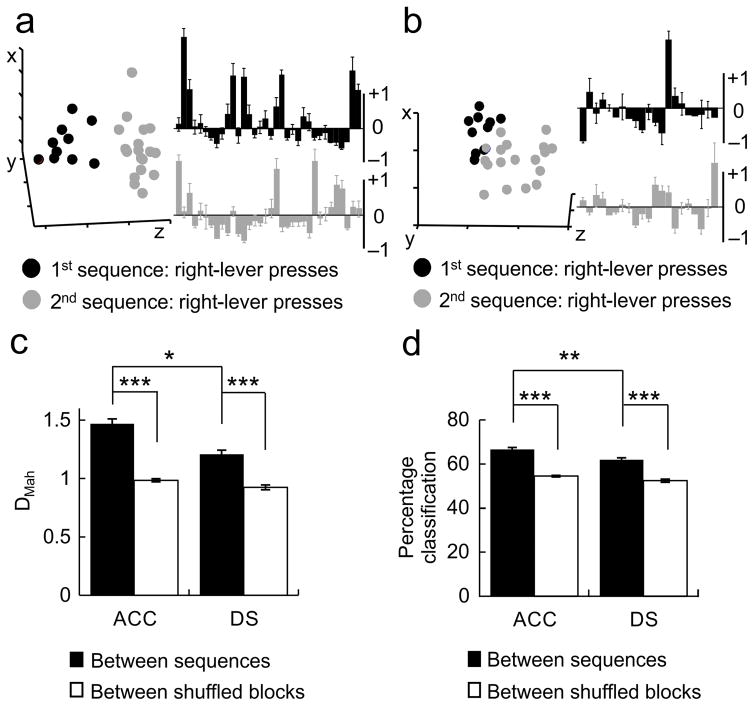
Sequence information is represented as differences in ensemble activity state patterns in both the ACC and DS. a) (Left) An example multiple single-unit activity (MSUA) space constructed from the iFRs of all 34 ACC neurons recorded during a single session, visualized in 3 dimensions using multidimensional scaling. Each dot represented a population vector containing the activities of the entire ensemble during right-lever presses. Dots were colored black if the activities were associated with one sequence block, gray if associated with the alternate sequence block. (Right) The average or prototypical activity of ACC neurons recorded during right lever presses in the two sequence blocks. Each bar represents the average normalized iFR for each neuron across all right lever presses in sequence block A (top, black bars) or sequence block B (bottom, gray bars). Mean ± s.e.m. b) (Left) An example MSUA space constructed from the iFRs of all 20 DS neurons recorded simultaneously during the same session as in (a). (Right) The prototypical activity of DS neurons recorded during right lever presses in the two sequence blocks. c) When common-segment lever press periods were examined, the average separation (DMah in MSUA space) between lever presses performed during different sequence blocks (black bars) were significantly larger than shuffled control blocks (white bars). d) A leave-one-out prediction procedure based on DMah was used to classify trials as belonging to one of two sequence blocks. Classification accuracy for the actual data (black bars) was significantly better than for trial shuffled data (white bars) for both the ACC and DS, although ACC ensembles performed significantly better than DS ensembles. *p<0.05, ** p<0.001, *** p<0.00001.

