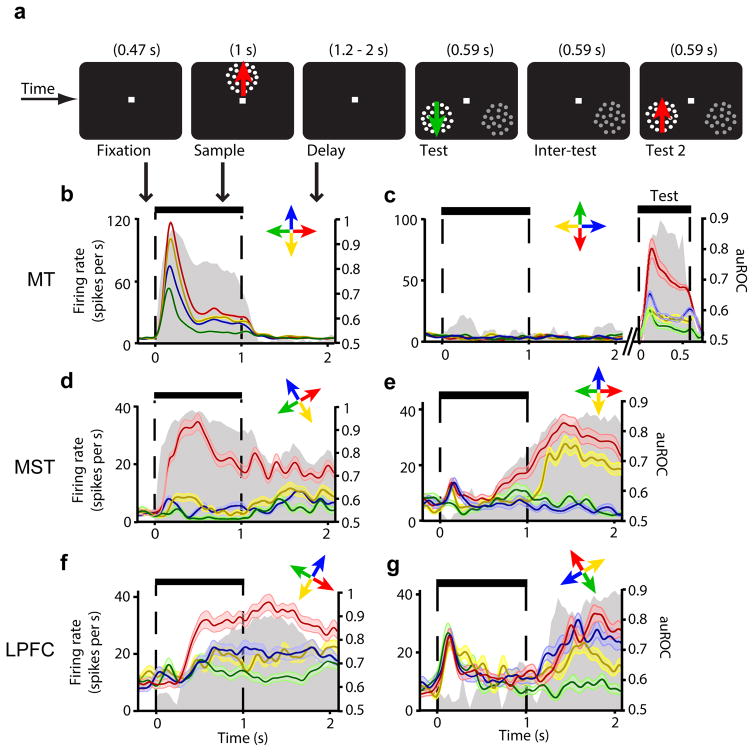
Figure 2. Firing rate across task periods for example neurons in MT, MST, and LPFC.
(a) Visual display during all task periods. (b–g) Mean firing rate (± standard error) over time in trials with each of the four sample directions (color-coded arrows) for neuron examples in MT (a,b), MST (c,d), and LPFC (e,f). Each neuron’s preferred direction is shown in red. Gray area shows corresponding auROC over time (right axis label). In (b), the test stimuli, but not the sample, were placed inside the neuron’s receptive field, and colors during the test period represent test directions.

