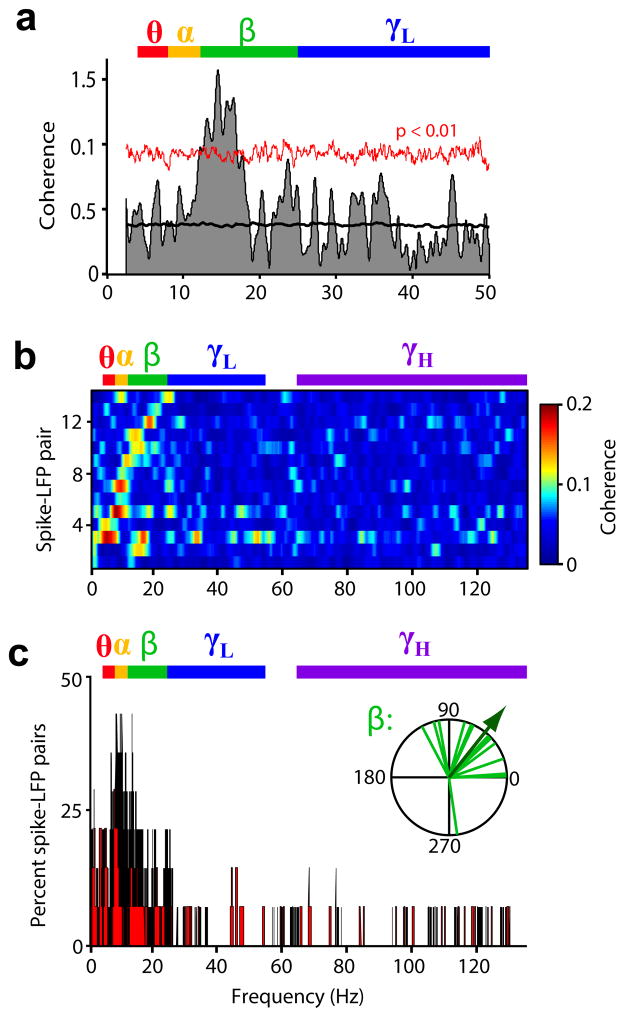
Figure 8. Spike-field synchrony between LPFC and MT during working memory.
(a) Spike-field phase coherence (shaded area) of example LPFC-MT pair as a function of LFP frequency; mean coherence among randomized surrogates (black line) and confidence limit of P < 0.01 computed from surrogates (red line). (b) Spike-field coherence as a function of LFP frequency for all significantly coherent pairs, sorted by frequency at peak coherence. (c) Among coherent pairs, percent reaching significant coherence at each frequency. Inset, phase of coherence for all coherent pairs in the beta band (in degrees). Arrow indicates mean phase across pairs. Frequency bands are color-coded.

